This chapter discusses how to use the PowerPlant Debugging classes to give you more control when debugging your PowerPlant code. In addition, the debugging classes provide interfaces to other debugging utilities if they are installed.
Debugging is a critical part of the software development cycle. There are many bugs that are difficult to track down using normal debugging techniques. In many cases, these bugs remain in the final release of software.
The PowerPlant debugging classes aid you in tracking down these bugs and give you a greater understanding of what happens in your code. The debugging classes are designed to "plug in" to your existing CodeWarrior projects with minimal changes to your code.
The topics discussed in this chapter are:
The debugging classes help you expose, diagnose, and prevent problems in your code before they become serious. Ultimately, the debugging classes try to help you write better code.
The debugging classes work on two levels. On one level, they provide
an easy interface for the PowerPlant debugging macros (Throw_ and Signal_) as well as additional classes to stress test and track down
various bugs in your code.
On another level, the debugging classes provide an easy interface to other utilities that can (and should) be used when debugging your PowerPlant project. Some of these utilities are provided by Metrowerks while others are provided by other companies. These utilities include:
new, checks for double-deletes, writing beyond the block's size,
dangling pointers, and more.
ftp://members.aol.com/JumpLong/.
 NOTE
NOTE Any debugger capable of catching Debugger() and DebugStr() traps reported by the PowerPlant Debugging classes can be used.
It's required that a debugger be installed or running as you debug
your application.
MacsBug, ZoneRanger, and DebugNew are provided on the CodeWarrior CD's. Demo versions of QC and Spotlight can be downloaded from the Onyx Technology web page at:
The PowerPlant Book for more information on using the Throw_ and Signal_ macros.
The PowerPlant debugging classes are designed to work in your existing projects with minimal changes to your code and no changes to your resources. Figure 2.1 shows the main classes.
The primary debugging classes: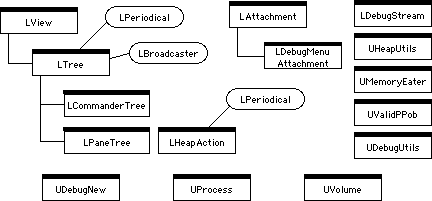
This section discusses the following classes:
Other important files include:
PP_DebugMacros.h-contains most of the Debugging Macros used by these classes. Using these macros while debugging will
catch many problems in your code.
PP Debug Support.ppob & PP Debug Support.rsrc-contain the necessary resources for use with the Debugging Classes.
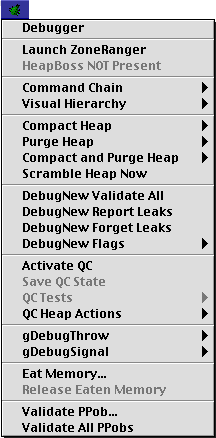
LDebugMenuAttachment is the main entry point for working with the debugging classes. It does the work of implementing the debugging menu.
The debug menu is added to your menu to give you easy access to many of the Debugging Classes' features. Figure 2.2 shows the Debug menu.
The debugging menu is created from a high numbered resource to try and reduce the impact if you implement the Debugging Classes in an existing project. See "Customizing the Debugging Classes" for information on what to do if you run into resource ID conflicts between your resources and those used by the Debugging Classes.
"Debugging PowerPlant Projects."
Provided you have all the supported tools installed, the debugging menu allows you to:
gDebugThrow and gDebugSignal at runtime without requiring you to recompile your code
LDebugMenuAttachment has many functions. There are five main functions that you need to know. These are shown in Table 2.1
Important LDebugMenuAttachment methods:
| Method |
Purpose |
|---|---|
You must build the LDebugMenuAttachment after the menubar is created or you will run into problems. The best
place to do this is in your application's Initialize() function. See The PowerPlant Book for more information on the
Initialize() function.
The SDebugInfo struct contains "preference" information about how you wish LDebugMenuAttachment
to behave. Currently SDebugInfo contains pane and resource ID's used by some of the classes.
This struct must be filled in completely. You can fill the struct with your own ID's, or call SetDebugInfoDefaults() to use the default ID's retreaved from PP_DebugConstants.h.
The best approach is to call SetDebugInfoDefaults() and then change only the fields you need changed as shown in
Listing 2.1.
	SDebugInfo theDebugInfo;
	LDebugMenuAttachment::SetDebugInfoDefaults(theDebugInfo);
	theDebugInfo.commanderTreePPobID = PPob_LCommanderTreeWindow;
	theDebugInfo.paneTreePPobID = PPob_LPaneTreeWindow;
	theDebugInfo.validPPobDlogID = PPob_DialogValidatePPob;
	theDebugInfo.eatMemPPobDlogID = PPob_EatMemoryDialog;
"Customizing the Debugging Classes" for more information.
InstallDebugMenu() is provided as a convenience for those that want to get up and
running quickly. However, InstallDebugMenu() uses defaults for all settings which may not be appropriate for
your particular needs.
LDebugStream is based on LStream (though not derived from LStream) that implements a one way (write-only) stream for reporting purposes. LDebugStream maintains an internal buffer of text (your debugging information) that flushes automatically, or when called explicitly.
The output can be sent to a file, to a debugger, or wherever gDebugThrow or gDebugSignal are set. When the output is sent to a file, the file is created
automatically. Alternatively, you can overwrite or append if the
file already exists.
LDebugStream has seven data members, as shown in Table 2.2.
| Data member |
Stores |
|---|---|
LDebugStream has accessor functions to get or set the value of each member variable.
The mFlushLocation member can have one of five values, as shown in Table 2.3.
| Value |
Meaning |
|---|---|
LDebugStream has many functions. The main functions are shown in Table 2.4.
| Function |
Purpose |
|---|---|
SetFilename() is called automatically by the LDebugStream constructor and sets
the file name to the name of your application plus "debug log."
However, you can call SetFilename to change the name of the output
file if you wish. This is what UValidPPob does.
TimeStamp() takes an LStr255 as a parameter and places the current date and
time in that string.
Flush() writes the internal buffer to a the location specified by inFlushLocation. If inDisposeAfterFlush is true, the internal data buffer is disposed of for a "full flush."
WriteData() and WriteBlock() both call PutBytes() to do their job.
As well, there are many redirection operators (<< and >>) that
can be used with LDebugStream. See LDebugStream.h for futher details.
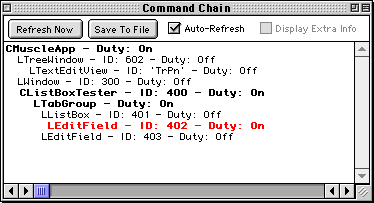
LCommanderTree is an extremely useful class to help determine Commander chain validity and diagnose Commander chain problems (a common occurrence).
LCommanderTree is a subclass of LTree that creates an information window displaying a visual representation of the command chain. LCommanderTree allows you to see each LCommander object in the command chain, including subcommanders and super-commanders, the state of each commander (on, latent, off), the current chain, and the current target.
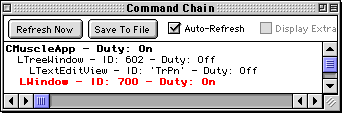
If the LCommander object is also a pane, the object's PaneIDT is also displayed in the window (Figure 2.3).
The Commander information is displayed using user-specified styles:
Txtr' resource in the PPob file.
Target Color. The default is red.
Each of these options can be changed to suit your style. See "Customizing the Debugging Classes" for more information.
Other than the visual appearance, LCommanderTree is designed to be used "as is" without programmer intervention. Accessor functions to control how often LCommanderTree updates the display are available in the Debug menu, or use the buttons provided in the Command Chain window.
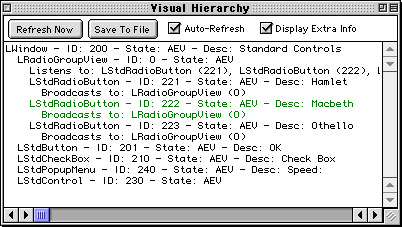
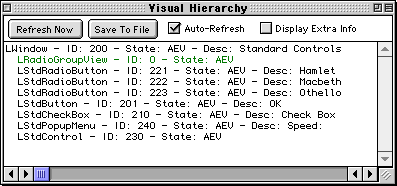
LPaneTree displays a visual hierarchy of a PowerPlant window or view. This visual hierarchy is similar to the Hierarchy View in Constructor, the difference being that Constructor displays the visual hierarchy in a PPob resource, LPaneTree displays the visual hierarchy at runtime.
LPaneTree displays the Pane by typename, PaneIDT, pane state (active, enabled, visible), and descriptor (if any).
Furthermore, LPaneTree can optionally display Attachment and Broadcaster/Listener,
information, hiliting the Pane currently under the cursor for
easy location of objects within a hierarchy (Figure 2.4).
The color used to hilite the cursor position can be changed in the PPob resource. See "Customizing the Debugging Classes" for more information.
In order to reduce the amount of drawing in the window, abbreviations are used where possible.
The following information is displayed for panes:
PaneIDT. (Will display as integer or FourCharCode automatically)
The following information is displayed for attachments:
the name/type of the object the MessageT to respond to (as integer) if ExecuteHost or not
Broadcaster/Listener information is displayed as follows:
Broadcaster/Listener information is always on the line following
the Broadcaster/Listener, indented, and in a simple list fashion.
the name of the Broadcaster/Listener if a Pane, the PaneIDT in parentheses
LPaneTree is designed to be used "as is" without programmer intervention. Accessor functions to control how often the visual hierarchy window updates are accessed through the Debug menu, or use the buttons provided in the Visual Hierachy window.
NOTE Currently, LPaneTree has one limitation. It cannot display the visual hierarchy of a floating window. This is mainly due to the fact that the DebugClasses' own floating windows would also be displayed, but are not actually part of your application. You can subclass LPaneTree if you require this functionality however.
LHeapAction is a PowerPlant LPeriodical subclass that performs various actions (compact, purge, compact & purge) on a given heap at specified intervals. LHeapAction calls UHeapUtils to do the actual work.
You control LHeapAction through the Debug menu, including starting, stopping, and changing the interval between operations.
UHeapUtils does all the actual work of compacting, purging, and scrambling the heap. UHeapUtils is actually a namespace so the functions can be called from anywhere in your code.
You control the heap through the Debug menu. This does not prevent you from calling the functions in UHeapUtils directly however.
UHeapUtils has four main functions as shown in Table 2.5.
| Function |
Description |
|---|---|
ScrambleHeap() requires QC or MacsBug to work. If MacsBug is used, the screen
will flicker as you drop in and out of MacsBug. If you use another
debugger (such as the IDE or SpotLight), this routine will not
work.
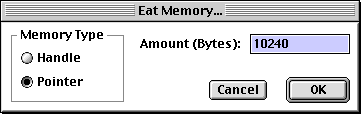
UMemoryEater is a class that allows you to consume memory in a controlled manner thus aiding you in testing how your program handles low memory conditions.
Choose Eat Memory from the Debug menu. The dialog box shown in Figure 2.5 appears. From here, you can control how much memory to consume
and how the memory is allocated (Handle or Pointer). You can then
release all the memory you used up by choosing Release Eaten Memory from the Debug menu.
It's best to use UMemoryEater in conjunction with a heap viewing utility such as ZoneRanger. This helps you make better estimates on how much memory to "eat" and gives you a better idea of your appliction's memory requirements.
UMemoryEater "zaps" it's blocks with specific values (PP_UMemoryEater_ZapValue) for easy identification in ZoneRanger. See UMemoryEater.cp for more information.
UDebugUtils is implemented as a namespace and contains a useful set of routines to check the debugging environment.
UDebugNew is a collection of mini-utilities to work with DebugNew. Table 2.6 describes what each fuction does.
| Function |
Description |
|---|---|
UProcess is a set of wrapper functions for the Mac Process Manager. These utilties can be easily used outside of the Debugging Classes.
UVolume is a collection of utility routines for manipulation and information gathering with volumes. Optionally uses MoreFiles if enabled. These utitlies can be used outside of the Debugging Classes.
UValidPPob validates PPobs by comparing what is within the PPobs vs. what is registered (in URegistrar). Helps to ensure you have everything registered that you should.
| Function |
Description |
|---|---|
ValidatePPob() presents a dialog requesting a PPob ID. Type in the PPob ID you
want to validate. Both functions can be accessed from the Debug
menu.
The Debugging Classes include many useful macros to make debugging easier and writing code easier and more robust. Also, many of these macros automatically call other utilities if they are present, eliminating the need to write extra code. The other benefit these macros provide is they can be left in final builds of your project. No need to write conditional preprocessor directives as this is automatically taken care of for you (see "Debugging PowerPlant Projects" for more information).
Not all macros are described here. You should look over PP_DebugMacros.h, UDebugNew.h, UHeapUtils.h, and UOnyx.h. These files contain other macros and usage comments helpful
in debugging.
The FindPaneByID_() macro simplifies FindPaneByID() and also performs a lot of the checking and safety for you.
First, it ensures the view isn't nil. Second, it performs a safe "getting" of the pane through dynamic_cast. FindPaneByID_() then checks if the returned pointer is nil. Finally, if all is well, the pointer is returned. Listing 2.2 shows an example of how to use FindPaneByID() normally.
Assert_(theWindow != nil);
LCaption *theCaption = dynamic_cast<LCaption*>
		(theWindow->FindPaneByID(1));
ThrowIfNil_(theCaption);
Listing 2.3 shows how to use FindPaneByID_() to perform the same task.
LCaption *theCaption = FindPaneByID_(theWindow, 1, LCaption);
Instead of throwing on failures, you can use FindPaneByIDNoThrow_() which raises signals and returns a nil pointer.
This macro is similar to DebugFindPaneByID_() in that it performs a dynamic_cast of one type to the other and then validates if the cast was successful
or not.
Validates the given pointer allocated via the Mac OS Toolbox routine
NewPtr() to ensure a non-nil value before using it. Calls QCVerifyPtr() if QC is installed. The pointer can not be allocated via new or malloc.
In non-debug builds, ValidatePtr_() only checks for nil.
Similar to ValidatePtr_() but for handles allocated via the Mac OS Toolbox routine NewHandle(). This macro also validates the master pointer. Calls QCVerifyHandle() if QC is installed.
Validates a C++ object allocated via operator new. ValidateObject_() must not be used on stack-based classes.
Only checks for nil in a final build.
Shortcut macro. Same as calling ValidateObject_(this).
Used to validate simple C++ objects allocated via operator new. Simple C++ objects are objects with no virtual functions (such
as LMenu).
These two macros ensure the handle is locked (or unlocked) before proceeding. Displays a signal dialog if the test fails.
Deletes the given object. Before deletion validates the pointer,
performs a few assertions. After deleting, sets the pointer variable
to nil. In release builds, DisposOf_() just deletes the object and sets the pointer to nil. No validation occurs.
Setting up an existing PowerPlant project to use the Debugging Classes is a straight forward process. If you used the PowerPlant stationery to create your own project (recommended) the basic infrastructure of non-debug-related classes (pane and control classes) is already part of the project. There are some additional requirements that you need to be aware of however.
This section discusses the following topics:
 TIP
TIP Instead of repeating this procedure every time you start a new project, use the "Advanced" stationery which includes the Debugging Classes.
Before adding the Debugging Classes to your project, you should make sure you have at least two build targets, one for debugging, the other for final or release build. The name of the build target itself does not matter.
For the debug build, make sure all debugging information is turned on and all optimizations are turned off. You can compre the settings used from the example project for this chapter discussed in "Debugging Code Exercise."
Another area to configure is the Prefix file used for the debug and release builds. One method (and the one used in the code exercise) is to use separate prefix files for debug and release builds that define the main debugging macro for your project. Each prefix file then #include's a "common" prefix file that sets up the preprocessor macros and other extras based on the value of your main debug macro "switch."
The master debug macro directive can be a unique value for every
project. Alternatively, you can use a generic name such as __APP_DEBUG__. If you create your own project stationery, this master compiler
directive then only needs to be set up once.
The IDE User's Guide and the C/C++ Compilers Reference for more information on debug settings.
The easiest method to add the main Debugging Classes to an existing
PowerPlant project is to simply drag the _Debugging Classes folder from the Finder to the CodeWarrior Project window. The
CodeWarrior IDE will prompt you for which build targets to include
these files in, add the access paths to those targets, and create
a group layout similar to the Finder layout.
Make sure you add these files to your debug build target (or targets) only. You can then remove the extra header files from your project if you wish.
The Debugging Classes require a few other files and classes to work properly. Depending on the needs of your application, you may already include these in your project.
LRadioGroupView.cp and UFloatingDesktop.cp need to be included in your project. If your project doesn't
require these files, make sure these files are only in the debug
build.
The debugging classes also use MetroNubUtils.c to determine dubugger information. This file should only be included
in your debug target.
There are a few files that conflict between the Debugging Classes and those used by all PowerPlant programs. For these cases, you need to make sure the files required by the Debugging Classes are only used in the debug build and those required by PowerPlant in the release build.
UFloatingDesktop.cp conflicts with UDesktop.cp. All PowerPlant programs must include one of these files. If your project does not use floating windows,
make sure UDesktop.cp is only included in your release build and UFloatingDesktop.cp is only included in the debug build. If your application uses
floating windows, you only need UFloatingDesktop.cp for both build targets.
Similarly, PP DebugAlerts.rsrc used in all PowerPlant applications, conflicts with the PP Debug Support.rsrc. file used by the Debugging Classes.
Finally, UDebugging.cp conflicts with UDebuggingPlus.cp used by the Debugging Classes.
Once your project is configured, you need to write the code to
install and configure the Debug menu as well as fill out the SDebugInfo structure.
1. Check the debugging environment
It is important to make a few checks to the debugging environment
before things proceed too far. Insert a call to UDebug-Utils::CheckEnvrionment() just after toolbox initialization. It must be done after the
toolbox is initialized because of the potential for dialogs to
be displayed.
This call ensures the debugging environment is ok before proceeding. If not, Signals are raised to alert you of the situation. This check is only needed if debugging.
There are actually a few different ways the LDebugMenuAttachment
can be created. You can use InstallDebugMenu(), or the LDebugMenuAttachment constructor, or use the method employed
by the code exersise later in this chapter. You need to perform
this step in your applicaiton's Initialize() method.
Note that if you use InstallDebugMenu(), LCommanderTree, LPaneTree and LTreeWindow are registered for
you.
If you want to change the default preferences used by LDebugMenuAttachment,
do not use InstallDebugMenu(). Instead, you should declare an SDebugInfo struct and call SetDebugInfoDefaults() to fill in the default values. You can then modify the settings
you want manually. Then call the LDebugMenuAttachment parameterized
contructor passing your SDebugInfo variable as shown in Listing 2.4.
SDebugInfo theDebugInfo;
LDebugMenuAttachment::SetDebugInfoDefaults(theDebugInfo);
theDebugInfo.commanderTreePPobID = PPob_LCommanderTreeWindow;
theDebugInfo.paneTreePPobID = PPob_LPaneTreeWindow;
theDebugInfo.validPPobDlogID = PPob_DialogValidatePPob;
theDebugInfo.eatMemPPobDlogID = PPob_EatMemoryDialog;
mDebugAttachment = NEW LDebugMenuAttachment(theDebugInfo);
Once the LDebugMenuAttachemnt is created, call InitDebugMenu() function and then add the attachment to your application object.
mDebugAttachment->InitDebugMenu(); AddAttachment(mDebugAttachment);
InitDebugMenu() performs the actual initialization of the Debug menu.
NOTE InitDebugMenu() must be called explicitly as this is one of the methods to override if you wish to customize the look and/or behaviour of the Debug menu. If InitDebugMenu() was called from the LDebugMenuAttachment constructor and you subclassed and overrode this method, your overide would never get called.
If you call InstallDebugMenu(), you can omit this step.
Make sure the menu is disposed of properly in your application
object's destructor by using the Debugging Classes' DisposOf_() macro.
Disposing the LDebugMenuAttachment:
#if __APP_DEBUG__
	DisposOf_(mDebugAttachment);
#endif
Since the Debug windows are created from PPob's, you need to ensure that you register all of the classes that are in those PPob's.
RegisterClass_(LTreeWindow);
RegisterClass_(LCommanderTree);
RegisterClass_(LPaneTree);
If you call InstallDebugMenu(), you can omit this step.
Depending on your needs, you may want to customize the Debugging Classes. The most common situation where you do this is when adding the Debugging Classes resources to an existing project causes resource ID conflicts.
All the resource ID's used by the Debugging Classes are stored
in an SDebugInfo struct. This struct is only used at initialization and is never
referred to again.
To solve the resource ID conflict, declare a local SDebugInfo variable. Then call SetDebugInfoDefaults() with your variable as a parameter. For example:
SDebugInfo theDebugInfo;
LDebugMenuAttachment::SetDebugInfoDefaults(theDebugInfo);
Now you can access the idividual fields of the SDebugInfo struct to make the appropriate changes. For example, if your
project doesn't use the Appearance Manager classes, change the
following fields:
theDebugInfo.commanderTreePPobID = PPob_LCommanderTreeWindow;
theDebugInfo.paneTreePPobID = PPob_LPaneTreeWindow;
theDebugInfo.validPPobDlogID = PPob_DialogValidatePPob;
theDebugInfo.eatMemPPobDlogID = PPob_EatMemoryDialog;
Look at LDebugMenuAttachment.h for a complete description of each field in the SDebugInfo struct.
Debugging is an imporant part of the software development cycle. The PowerPlant Debugging Classes enable you to track down subtle bugs in existing or new projects. The Debugging Classes are easy to set up and use but are flexable enough to conform to the needs of any project.
There is much more to these classes than can be covered in a single chapter. You are encouraged to read through the source code and comments for the Debugging Classes and the example exercise.
The code example for this chapter provides a good overview of how to set up and use various classes when debugging your projects.
In this exercise, you use the debugging classes to find various bugs in the code. The purpose of this exercise is to give you a feel for how to use the debugging classes in a real world project and the benefits the classes provide you as a developer. This exercise is not a tutorial in debugging technique, though you may garner some useful tidbits here that you can use in your own code.
 WARNING!
 This example must contain obvious errors and other problems in order to demonstrate the utility and significance of the PowerPlant Debugging Classes. As such, there may be steps that cause the application, or even your system, to crash. It's recommended you perform a backup of your system before proceeding with this example.
The program itself doesn't do anything spectacular, but is structured to demonstrate the utility of the Debugging Classes. Each step that requires code input is shown in the source with a delimiter to find things quicker. The delimiter is:
// Insert Step # below
// Insert Step # above
The purpose of this step is to give you an overview of how a project is set up. This is not the only way to set up a project, but it is a simple example.
The first thing to note is there are separate debugging and release targets. The Debugging targets are set up with all optimizations turned off and all debug information (Tracebacks, Generate SYM info, etc.) turned on. The release builds turn off all debugging info and have full optimization settings.
Note as well the different files that are included in the debug and release builds. Of course, all the Debugging Classes are only in the debug target. However, there are some more subtle changes.
For example, UDebuggingPlus.cp and PP Debug Suport.rsrc are only in the debug build. UDebuging.cp and PP DebugAlerts.rsrc are only in the release builds. This is a similar technique to
how UFloatingDesktop.cp and UDesktop.cp are used in some PowerPlant projects.
Also note that some classes (mainly pane classes) are not included in the final build. This is because of a desire to include only those files directly needed for a target. The Debugging Classes have a bit of an infrastructure requirement.
Lastly, there are no precompiled header files, but there are prefix files. The prefix files are set up to handle the different targets (debug, final). This is done because there are different desires for the code depending on what is being targeted. For example, in the debug prefix, various debug supports are enabled but disabled in the final prefix.
There are three prefix files. MuscleDebug.h and MuscleFinal.h define the conditional debugging macro __MUSCLE_DEBUG__ depending if it's a debug or final build. Both of these files
include MusclePrefixCommon.h, in which all the work is really done.
The prefix files are set up this way for easy maintenance. Having all the central information in one place reduces the number of places to try and find information if you need to change something.
For this step, you'll define the macros required for supporting the debugging classes.
//··· Insert Step 2 below
#if __MUSCLE_DEBUG__

		// Establish core PowerPlant Debug macros
	#define Debug_Throw
	#define Debug_Signal

		// Ensure the PowerPlant Debugging macros are set
		// as needed to be. Note that 3rd party supports are
		// disabled.
	#define PP_Debug             1
	#define PP_MoreFiles_Support 0
	#define PP_Spotlight_Support 0
	#define PP_QC_Support        0
	#define PP_DebugNew_Support  1

		// Set DebugNew to full strength
	#define DEBUG_NEW 2 // DEBUG_NEW_LEAKS

#else

		// Not debugging, so ensure debugging flags are off
	#define PP_Debug             0
	#define PP_MoreFiles_Support 0
	#define PP_Spotlight_Support 0
	#define PP_QC_Support        0
	#define PP_DebugNew_Support  0

	#define DEBUG_NEW 0

#endif

//··· Insert Step 2 above
NOTE For the purposes of this chapter, the third party support for QC, SpotLight, and MoreFiles are disabled. If you have any of these utilities, feel free to enable them by changing the appropriate macro setting.
3. Check the debugging environment
It is important to make a few checks to the debugging environment
before things proceed too far. Insert a call to UDebug-Utils::CheckEnvrionment() just after toolbox initialization. It must be done after the
toolbox is initialized because there is potential for dialogs
to be displayed.
This call ensures the debugging environment is ok before proceeding. If not, Signals are raised to alert you of the situation. This check is only needed if debugging.
//··· Insert Step 3 below
#if PP_Debug
	UDebugUtils::CheckEnvironment(); // Debugging environment checks
#endif

//··· Insert Step 3 above
Here, you hook up the Debug menu, register the appropriate classes,
and then clean up when your application quits. Take into account
that this step only needs to be done in the debug build by using
the application __MUSCLE_DEBUG__ macro.
Declare an SDebugInfo instance and initialize it with the defaults by calling SetDebugInfoDefaults(). Then modify a few settings so that the Appearance Manager classes
are not used.
Create the LDebugMenuAttachment by using NEW so that DebugNew can track any leaks. Use the ValidateObject_() macro to ensure the pointer just allocated is sound.
Finally, Initialize the menu and add the attachment.
//··· Insert Step 4a below
#if __MUSCLE_DEBUG__

	SDebugInfo theDebugInfo;
	LDebugMenuAttachment::SetDebugInfoDefaults(theDebugInfo);
	theDebugInfo.commanderTreePPobID = PPob_LCommanderTreeWindow;
	theDebugInfo.paneTreePPobID = PPob_LPaneTreeWindow;
	theDebugInfo.validPPobDlogID = PPob_DialogValidatePPob;
	theDebugInfo.eatMemPPobDlogID = PPob_EatMemoryDialog;

	mDebugAttachment = NEW LDebugMenuAttachment(theDebugInfo);
	ValidateObject_(mDebugAttachment);

	mDebugAttachment->InitDebugMenu();

	AddAttachment(mDebugAttachment);

#endif

//··· Insert Step 4a above
Make sure the menu is disposed of properly in your application
object's destructor by using the Debugging Classes' DisposOf_() macro.
//···þInsert Step 4b below
#if __MUSCLE_DEBUG__
	DisposOf_(mDebugAttachment);
#endif

//··· Insert Step 4b above
c. Register the required classes
Since the Debug windows are created from PPob's, you need to ensure that you register all of the classes that are in those PPob's.
Many classes are already registered (e.g.: LWindow, LDialogBox, LEditField, etc.) because they are required by the application. But the LCommanderTree, LPaneTree and LTreeWindow need to be registered.
//··· Insert step 4c below
	RegisterClass_(LTreeWindow);
	RegisterClass_(LCommanderTree);
	RegisterClass_(LPaneTree);

//··· Insert step 4c above
All the main set up for the Debugging Classes are now completed. From this point on, you'll compile and run the application after each step. This allows you to see how things work more easily.
5. Write the BuildDocument() function
The real purpose of this step is to write some code to show the
use of various debug macros (such as ValidateHandle_() and FindPaneByID_() ) as well as showing some places to use stack-based classes.
//··· Insert Step 4 below
		// Place the inFile into an StDeleter object so we can
		// guarentee cleanup in case an exception is thrown.
	StDeleter<LFile> theFile(inFile);

		// Read in the file's data
	theFile->OpenDataFork(fsRdPerm);
	StHandleBlock textH(theFile->ReadDataFork());
	ValidateHandle_(textH.Get());
	theFile->CloseDataFork();

		// Create the window to display the file's data
	LWindow* theWindow = LWindow::CreateWindow(Wind_TextEdit, this);

		// Set the window's title to the file's name
	FSSpec theFileSpec;
	theFile->GetSpecifier(theFileSpec);
	theWindow->SetDescriptor(theFileSpec.name);

		// Insert the file's data into the Window/TextEdit object
	LTextEditView* theText = FindPaneByID_(theWindow,
                textEdit_One, LTextEditView);
	theText->SetTextHandle(textH);

		// Finally, show the window
	theWindow->Show();

//··· Insert Step 4 above
Compile and run the application. Look over the options in the
Debug menu. Choose Table from the Demo menu. Notice the alert? That's because there's
a class that isn't registered yet. Quit the application and continue.
Memory leaks are a very common occurrence in many programs. The Debugging Classes in cooperation with DebugNew help you check for memory leaks in your code.
CListTester.cp JStringView::ListenToMessage()
For this step, you write code to handle messages in the JStringView
class that uses DebugNew's NEW macro, more validation macros, and the DebugCast_() macro.
//··· Insert step 6a below

		case msg_InsertJ: {
			mPositionField->GetDescriptor(str);
			::StringToNum(str, &pos);
			mStringField->GetDescriptor(str);
			JString* j = NEW JString(str);
			ValidateSimpleObject_(j);
			mJStringList.InsertItemsAt(1, pos, j);
			Refresh();
			break;
		}

		case msg_Iterator: {
			JIteratorWindow* theJWindow = DebugCast_(LWindow::CreateWindow(Wind_Iterator, this),
														LWindow,JIteratorWindow );
			theJWindow->SetUp(mJStringList);
			theJWindow->Show();
			break;
		}

//··· Insert step 6a above
Make the project and run. From the Demo menu, choose List Tester. Click the Insert button a few times to add some strings to the list. Quit the
application.
A leaks.log file is created in the same folder as your application. It should
contain a list of some leaks found in the JStringView::ListenToMessage() you just entered. There are also two other leaks of a similar
nature.
The leaks.log lists the file name and line numbers the leaks occurred on. Look
at those line numbers in your file.
These leaks were caused because memory is allocated for the string
when you clicked on the Insert button. However, nothing is ever done to explicitly delete those
strings when you were finished using them. You must ensure that
the memory used for the string list is fully cleaned up after
use.
TIP If you have Spotlight and run the demo application through Spotlight, repeating the same steps, you should receive the same results in the Spotlight log. Try it if you have it (and have Spotlight support enabled).
CListTester.cp JStringView::~JStringView()
mJStringList is an object within the JStringView object. There is no need
to dispose of that object as that is handled automatically when
the JStringView object is destroyed.
However, since you allocated the JString objects within the mJstringList, you must dispose of them as well.
//···þInsert step 6c below
	TArrayIterator<JString*> iterator(mJStringList);
	JString* j;

	while (iterator.Next(j)) {
		mJStringList.Remove(j);
		ForgetSimple_(j);
	}

//··· Insert step 6c above
TArrayIterator is used to walk the list of objects, we then remove
the object. Forget_() is the same as DisposOf_(), just different wording. ForgetSimple_() is used here because JString is a simple object (no virtual methods).
If you tried using Forget_() here, the compiler will complain with an illegal typecast error.
Now recompile the run the application again, repeating the same
steps. This time, there should be no leaks reported in the leaks.log file. This one change takes care of the other two leaks as well.
This step demos ZoneRanger and the Eat Memory dialog to demonstrate how to use a few of the items in the Debug menu and show how they can be useful.
b. Choose Launch ZoneRanger from the Debug menu.
Open the Summary window for Muscle Debug and position it where you can see it clearly while running the Muscle Debug.
c. Switch back to Muscle Debug
Keep an eye on the numbers in the ZoneRanger Summary window. Notice the number of free bytes reported by ZoneRanger.
WARNING! The next few steps could crash the demo application and/or your computer depending on your system.
Choose Eat Memory from the Debug menu and gobble up slightly less (about 200K less) than the default value. You can choose either Handle or Pointer, it doesn't matter.
Now use Muscle Debug as a normal application. Open some windows, create new windows, etc. However, do this slowly. One at a time. Watch the ZoneRanger window to see your free memory being used up.
Depending on what you do and exactly how things are set up and react, you may get varying results:
¯ a Signal dialog may come up to say the reanimation of a class failed
¯ a Throw dialog may come up because of a failure
If these things occur, you are seeing UDebuggingPlus in action.
Feel free to try the various buttons but be aware that you are
in a low memory situation and your system could crash. Eventually,
the GrowZone() function will kick in.
Quit Muscle Debug and restart your computer. This will clear up any lingering memory and heap problems
The ZoneRanger Guide for more detailed information on how to use ZoneRanger.
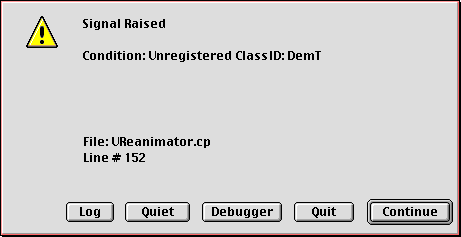
In this step, you use PPob validation to find what classes are in your PPob's that are not in the registry table.
Choose Table from the Demo menu. The Dialog in Figure 2.6 appears. This is one way to find out what needs to be validated
or registered, but it's not the easiest method.
Choose Validate All PPob's from the Debug menu. A file called PPob Validation debug log is created in the same folder as your application. Open this
file and examine the log.
NOTE If you are not using the Appearance Manager, you can ignore the lines referring to the Appearance Manager classes.
The PPob named "Table" with class ID `DemT' is unregistered. Register the class.
//··· Insert step 8e below
	RegisterClass_(CDemoTable);
//··· Insert step 8e above
Make and Run the application again. Validate All PPob's and open the Table window. Everything should now be OK.
This step shows you how to use the Command Tree window to find problems with the command chain.
Run Muscle Debug (if not already running). Chose Command Chain from the Debug menu. Choose an update interval from the Command
Chain submenu.
Choose Floater from the Demo menu. Notice that the floating window is targetable
(Figure 2.7). Floating windows in PowerPlant should not be targetable.
Open Muscle.PPob with Constructor. Open PPob ID 700 (the floating window). Change the Targetable setting in the Property Inspector window. Save the PPob. Make
and run the application.
This step shows you how to use the Visual Hierarchy window to find errors in the PPob file itself.
Run Muscle Debug (if not already running).
Choose Standard Controls from the Demo menu.
The radio buttons do not behave correctly. They will each become enabled, and you can't disable them.
d. Open the Visual Hierarchy window
Choose Visual Hierarchy from the Debug menu. Notice that the LRadioGroupView does not
control the radio buttons (Figure 2.8). The radio buttons need to be sub-views of the LRadioGroupView
and they are not.
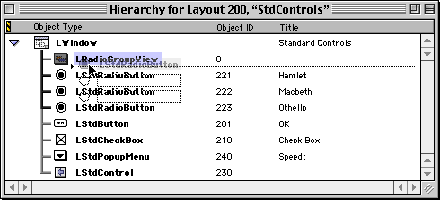
Open Muscle.PPob with Constructor and open PPob ID 200 (Standard Controls). Open the Hierarchy window and move the three
radio buttons to be subviews of the LRadioGroupView (Figure 2.9).
Compile and run Muscle Debug one last time to ensure everything is in order.
Congratulations! You've found all known bugs in this application.
Now that you have an understanding of how to use the PowerPlant Debugging Classes, you can implement them in your own projects.
There are a few things you can do with Muscle Debug still, however. You can try to fix how low memory situations are handled for example.
A lot goes on "behind the scenes" in the Debugging Classes that could not be demonstrated in this chapter. Read the code and comments for the Debugging Classes. Also read the code and comments for Muscle Debug and look at all the various things done to help with housekeeping and debugging.
If you own third party utilities such as QC or Spotlight, try activating their support (the preprocessor macro) and run the demo again from the beginning and see if you can catch any other problems.