This chapter contains the detailed technical reference information you may need when using the profiler.
You can control routine-level profiling using compiler directives.
The C/C++ compiler supports three preprocessor directives that you can use to turn compiling on and off at will.
You can use these directives to turn profiling on for any functions you want to profile, regardless of the settings in the Processor preferences. You can also turn off profiling for any function you don't want to profile.
As there are compiler directives to turn the profiler on and off, there are also directives to test if the profiler is on. You can use these tests in your code so that you can run your program with or without the profiler and not have to modify your code each time.
In C/C++, use the #if-#endif clause. For example:
void main()
{
#if __profile__    // is the profiler on?
	if (!ProfilerInit(collectDetailed, bestTimeBase, 20, 5))
	{
#endif
		test(15);
#if __profile__
		ProfilerDump("\pExample.prof");
		ProfilerTerm();
	}
#endif
}
In Pascal, use the following test:
{$IFC OPTION(PROF)}
	if (ProfilerInit(collectDetailed, bestTimebase,
						100, 20) = noErr) then begin
{$ENDC}
See also "Routine-level profiling."
The profiler allocates two buffers in temporary memory to hold
data as it collects information about your code: one based on
the number of routines, and one based on the stack depth. You
pass these parameters in your call to ProfilerInit().
In summary collection mode, the profiler allocates 64 bytes *
numFunctions and 40 bytes * stackDepth.
In detailed collection mode, the profiler allocates 12 * 64 *
numFunctions bytes and 40 * stackDepth bytes.
As an example, assume numFunctions is set to 100, and stackDepth to 10. In summary mode the profiler allocates buffers of 6,400
bytes and 400 bytes. In detailed mode it allocates buffers of
76,800 bytes and 400 bytes.
ProfilerGetDataSizes() lets you query the profiler for the current size of the data
collected in the function and stack tables. This information can
be used to tune the parameters passed to ProfilerInit().
See also "ProfilerInit()."
The CodeWarrior profiler supports four timebases. A timebase is the clock interval used to measure time in a routine. The shorter the interval, the more precise the measurements.
When you call ProfilerInit() you specify the desired timebase. The constant bestTimeBase tells the profiler to figure out the most precise timebase available
on your platform and to use it.
Table 8.1 describes each timebase:
 WARNING!
 PPCTimeBase does not work correctly under Mac OS X. If you use it, you actually
get microseconds timing instead.
This reference section discusses the functionality of each menu item in MW Profiler, the data viewing application for the CodeWarrior profiler system.
Choosing About Metrowerks Profiler from the Apple menu displays copyright and author information
about the application.
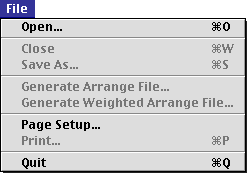
The File menu contains commands to open, close, save, and print documents, and to quit the application, as illustrated in Figure 8.1.
Open displays the standard open file dialog that allows you to select and open an existing MW Profiler document.
Close closes the active window.
Save Report As or Save As saves the contents of the active window as a tab-delimited text document. The text file is organized the same way that the window is organized.
Generate Arrange File generates a link arrangement file using a depth-first traveral
algorithm. The final .arr file can then be linked back into your project to produce even
faster code.
Generate Weighted Arrange File is the same as Generate Arrange File but uses a true call frequency ordering algorithm which produces
better results. The final .arr file can then be linked back into your project to produce even
faster code.
Page Setup or Print Setup displays the standard page setup dialog for the current printer.
 TIP
TIP To fit the profiler output across one page, select landscape orientation and 85% reduction.
Print Preview shows what the data file will look like when you print it out on paper.
Print prints the MW Profiler document in accord with the current view and sort order in the window.
Quit quits the MW Profiler application.
All Edit menu items are disabled. There is nothing to cut, copy, paste, clear, or select in an MW Profiler window.
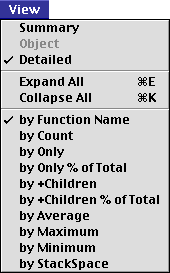
The View menu contains commands to sort and view MW Profiler data. The currently active option has a check mark in front of the menu item. You may also click on the column header to sort the data by the values in that column. Figure 8.2 shows the options that you can choose.
collectDetailed method be used.
The windows menu lists all the open profiler data windows.
This is a reference for all Profiler functions mentioned in the text of this manual. The functions described in this chapter are:
The discussion of each function includes the following attributes:
ProfilerInit() Description :
ProfilerInit() prepares the profiler for use and turns the profiler on. The
parameters tell the profiler how this collection run is going
to operate, and how much memory to allocate. ProfilerInit() must be the first profiler call before you can call any other routine
in the profiler API.
Prototypes:
typedef enum { collectDetailed,
collectSummary
} ProfilerCollectionMethod;
typedef enum { ticksTimeBase,
timeMgrTimeBase,
microsecondsTimeBase,
PPCTimeBase,
bestTimeBase
} ProfilerTimeBase;
pascal OSErr ProfilerInit( ProfilerCollectionMethod method,
ProfilerTimeBase timeBase,
long numFunctions,short stackDepth);
Remarks :
ProfilerInit() attempts to allocate memory in the Process Manager heap (temporary
memory). If it can't get the required memory in that heap, it
tries in the current heap. This strategy minimizes the effect
that the profiler has on the application's memory partition.
ProfilerInit() can return memory manager errors such as memFullErr and paramErr. If paramErr is returned, it means that one of the constants passed in was
out of range, or that Profiler-Init() has already been called.
The method and timeBase parameters select the appropriate profiler options. The numFunctions parameter indicates the number of routines in the program for
which the profiler should allocate buffer storage. If the profiler
is operating in detailed mode, this number is internally increased
(exponentially), because of the branching factors involved. The
stackDepth parameter indicates how many routines deep the stack can get.
A call to ProfilerInit() must be followed by a matching call to ProfilerTerm().
ProfilerTerm() Description:
ProfilerTerm() stops the profiler and deallocates the profiler's buffers. It
calls ProfilerDump() to dump out any information that has not been dumped. ProfilerTerm() must be called at the end of a profile session.
Prototypes: void ProfilerTerm( void );
Remarks :
If a program exits after calling ProfilerInit() without calling ProfilerTerm(), timers may be left running that could crash the machine.
ProfilerSetStatus() Description :
ProfilerSetStatus() lets you turn profiler recording on and off in the program. This
makes it possible to profile specific sections of your code such
as screen redraw or a calculation engine. The profiler output
makes more sense if the profiler is turned on and off in the same
routine, rather than in different routines.
Prototypes: pascal void ProfilerSetStatus( short on );
Remarks :
This routine and ProfilerGetStatus() are the only profiler routines that may be called at interrupt
time.
Pass 1 to turn recording on and 0 to turn recording off.
ProfilerGetStatus() Description:
ProfilerGetStatus() lets you query the profiler to determine if it is collecting
profile information.
Prototypes: pascal short ProfilerGetStatus( void );
Remarks:
This routine and ProfilerSetStatus() are the only profiler routines that may be called at interrupt
time.
ProfilerGetStatus() returns a 1 if the profiler is currently recording, 0 if it is
not.
ProfilerGetDataSizes() Description:
ProfilerGetDataSizes() lets you query the profiler for the current size of the data
collected in the function and stack tables. This information can
be used to tune the parameters passed to ProfilerInit().
Prototypes:
pascal void ProfilerGetDataSizes( long *functionSize,
long *stackSize);
Remarks:
If you have passed collectDetailed to ProfilerInit(), ProfilerGetDataSizes() returns the number of actual routines in the table, which may
be larger than the value passed to ProfilerInit() in numFunctions. This is because the profiler multiplies numFunctions by 12 when it allocates the table. The multiplication is done
so that you can easily switch between collectDetailed and collectSummary methods without changing the parameters.
ProfilerDump() Description:
ProfilerDump() dumps the current profile information without clearing it. The
filename passed must be a Pascal string.
Prototypes: pascal OSErr ProfilerDump( StringPtr filename );
Remarks:
This can be useful for dumping intermediate results on a long task. If the specified file already exists, a new file is created with an incrementing number appended to the filename. This allows the dump to be called inside a loop with a constant filename.
ProfilerDump() can return memory manager errors such as memFullErr, or file system errors.
ProfilerClear() Description:
ProfilerClear() clears any profile information from the buffers.
Prototypes: pascal void ProfilerClear( void );
Remarks:
ProfilerClear() retains the settings of collectionMethod and timeBase that were set by ProfilerInit(). It does not deallocate the buffers.
ProfilerCreateThread() Description:
Use ProfilerCreateThread() to create a profiler thread structure to track the information
in a new thread. You should call this routine whenever you create
a new thread. This call creates the necessary profiler buffers
and returns a reference used by the profiler. The threadRef provided by this routine must be stored with the thread and passed
to ProfilerSwitchToThread() in the thread's swapIn proc.
Prototypes:
typedef unsigned long ProfilerThreadRef; pascal OSErr ProfilerCreateThread(
short stackSize, long byteStackSize,
ProfilerThreadRef *threadRef);
Remarks:
The stackSize parameter is the number of profiler frames to use. The byteStackSize parameter is the size in bytes of the stack that was created.
This is done so that you can use these routines with any threads
package, the profiler does not include any explicit calls to the
Thread Manager.
This routine allocates memory in the current heap.
ProfilerDeleteThread() Description:
When a thread terminates, call ProfilerDeleteThread() to clean up the profiler thread tracking structures.
Prototypes:
pascal void ProfilerDeleteThread( ProfilerThreadRef thread);
Remarks:
Returns paramErr if the ProfilerThreadRef passed in is not a threadRef returned from ProfilerCreateThread().
ProfilerSwitchToThread() Description:
Call ProfilerSwitchToThread() from the swapIn proc of the thread, passing the threadRef returned from ProfilerCreateThread().
Prototypes:
pascal void ProfilerSwitchToThread( ProfilerThreadRef thread);
Remarks:
Returns paramErr if not a threadRef returned from ProfilerCreate-Thread().
ProfilerGetMainThreadRef() Description:
ProfilerGetMainThreadRef() returns the threadRef of the implicitly created main thread. threadRef is a pointer to an internal data structure.
Prototypes:
pascal Remarks: ProfilerThreadRef ProfilerGetMainThreadRef();
Use this call to get the threadRef. Necessary to switch back to the main thread with ProfilerSwitchToThread().
TIP PowerPlant has been set up to make the profiler thread calls for you. Look at the threads classes for examples on how to use the profiler thread routines.