The CodeWarrior profiler lets you analyze how processor time is distributed during your program's execution. With this information, you can determine where to concentrate your efforts to optimize your code most effectively.
This chapter discusses the following principal topics:
The CodeWarrior profiler is a state-of-the-art, user-friendly, analytical tool that can profile C or C++ code.
For every project, from the simplest to the most complex, the profiler offers many useful features that help you analyze your code. You can:
The CodeWarrior profiler is an active profiler. The profiling system consists of three main components:
Details of the API are discussed in "Profiler API." The MW Profiler application is discussed in "Viewing Results."
The rest of this chapter will discuss the general profiling process. Subsequent chapters describe how to carry out the profiling process for your particular target.
To use the profiler, you do these things:
Include the correct profiler library and files in your CodeWarrior project Modify your source code to make use of the profiler API Use the API to initialize the profiler, to dump the results into a file, and to exit the profiler Use the MW Profiler application to view the results
You can profile an entire program if you wish or, adding compiler directives to your code, you can profile any individual section of your program.
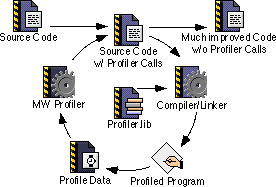
Figure 3.1 illustrates the flow of events that occurs when you profile code.
You modify the original source code slightly to initialize the profiler, dump results, and exit the profiler when through. You may modify the source code more extensively if you wish to profile individual portions of your code.
Then the compiler and linker-using a profiler library-generate a new version of your program, ready for profiling. While it runs, the profiler generates data. Your program will run a little more slowly because of the profiler overhead (sometimes a lot more slowly), but that's taken into account in the final results. When complete, you use the MW Profiler application to analyze the data and determine what changes are appropriate to improve performance. You can repeat the process as often as desired until you have turned your code into a fast, efficient, well-oiled machine.
"Profiler API" and "Viewing Results."
This section takes you step by step through the general process of profiling an application.
To profile an application, you do the following:
1. Add a profiler library to the project
3. Include the profiler API interface
In the steps that follow, we'll detail precisely what to do in both C/C++ and Pascal. These steps may seem a little complicated. Don't be alarmed. Using the CodeWarrior profiler is actually easier than reading about how to do it.
1. Add a profiler library to the project
The code that performs the profiler magic has been compiled into libraries. The precise library that you add to your code depends on the target for which you're profiling code and on the kind of code you're developing. For more information about adding the appropriate libraries for your particular target, read "Profiling Mac OS Code."
For example, Figure 3.2 shows how to add the appropriate library for your code model when profiling code for a Mac OS PowerPC target.
The PowerPC profiler library in a project: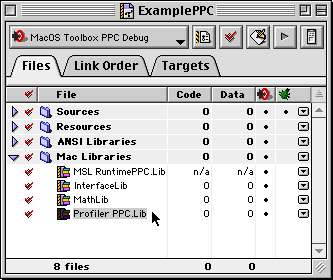
You can use the following methods to turn profiling on or off:
To turn on profiling for an entire project, use the project settings. In the Project Settings dialog, choose the processor you are generating code for (68K Processor or PPC Processor) under the Code Generation option. Click the Generate Profiler Information checkbox as shown in Figure 3.3. With profiling on, the compiler generates all the code necessary so that every routine calls the profiler.
Processor Preferences options for PowerPC: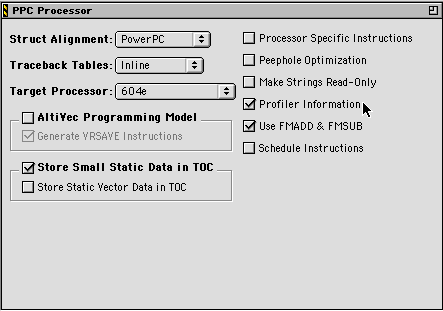
To profile certain routines (rather than the entire project), use the appropriate profiler API calls for your target to initialize the profiler, set up profiling, and immediately turn profiling off. You can then manually turn profiling on and off by placing profiler calls around the routine or routines you want to profile. For example, you could modify Mac OS code to look like Listing 3.1.
void main()
{
	...
	err = ProfilerInit(...);
	if (err == noErr)
	{
		ProfilerSetStatus(FALSE); // turn off profiling until needed.
		// more code....

		// now you reach routine you want to profile
		ProfilerSetStatus(TRUE);  // turn on profiling
		foobar();  // this routine is profiled and shows up in viewer
		ProfilerSetStatus(FALSE);  // turn profiling off again

		// more code....
		ProfilerTerm();
	}
}
Assuming that profiling is on for an entire project, you can turn off profiling at any time. First, use an appropriate call to turn off profiling. Then use another call to turn it on. Turn it on just before calling the routine or routines you are interested in. Turn it off when those routines return. It's really that easy.
Alternatively, you can use #pragma statements in C/C++. These aren't as useful as using profiler
API calls. For example, suppose you have two routines-foo() and bar()-that each call a third utility routine, barsoom(). If you use compiler directives to turn on profiling for foo() and barsoom(), the result you get will include the time for barsoom() when called from bar() as well.
3. Include the profiler API interface
To use the profiler, you add at least three profiler-related calls to your code. These calls are detailed in the next three steps. The process varies slightly for the different languages and targets.
Source files that make calls to the profiler API must include
the appropriate header file for your target. For example, to profile
an entire Mac OS application, you would add this line of code
to the source file that includes your main() function:
 TIP
TIP You don't have to include the header file in every file that contains a profiled function, only in those that actually make direct profiler API calls.
At the beginning of your code, you call the appropriate function for your target. See "Profiler API" to find out the precise function name that you'll need for your specific target.
Obviously, if you profile code you want to see the results. The profiler dumps the results to a data file. The data is in a proprietary format understood by the MW Profiler viewing application.
TIP Although the original profiler data file is in a proprietary format, you can use the Save As... command in the MW Profiler File menu to save the data in a tab-delimited text file.
When you are all through with the profiler, before exiting the program you must terminate the profiler by calling the correct profiler API function. If you initialize the profiler and then exit the program without terminating the profiler, timers may be left running that could crash the machine.
The call to terminate the profiler stops the profiler and deallocates memory. It does not dump any information. Any collected data that has not been dumped is lost when you call the function to terminate the profiler.
Having performed these quick steps, you simply compile your program and run it. When you quit, the results will be waiting for your analysis. MW Profiler, the viewing application, is introduced in "Viewing Results."
In summary, the process of using the CodeWarrior profiler is quite easy. You add the requisite library, turn on profiling, include the header file, initialize the profiler, dump the results, and exit. It is a remarkably painless and simple process that quickly gets you all the data you need to perform a professional-level analysis of your application's runtime behavior.