There are many types of code that can be written to run on the Mac OS. Each type has its own idiosyncrasies for writing and debugging. This chapter discusses how to make efficient use of the CodeWarrior IDE to debug different types of code.
The following types of debugging are discussed in this chapter:
For general information on the CodeWarrior debugger, refer to the IDE User Guide.
Refer to Targeting Win32 if you are interested in configuring the Mac OS-hosted IDE to debug Windows software.
CodeWarrior Mac OS-hosted tools support remote debugging. This
means that you can use CodeWarrior debugger on one system (the
local system) to debug a Mac OS application running on another system (the
remote system).
This section focuses on debugging remote Mac OS applications. For information on debugging remote Windows applications, see the Targeting Windows manual. For information on debugging remote Java applications, see the Targeting the Java VM manual.
This section steps you through setting up the CodeWarrior IDE for remote debugging and starting a remote debug session. The steps you must take to debug the remote application differ slightly depending on whether the application is running in classic Mac OS or Mac OS X.
Throughout this section, information that only applies to remote debugging applications running in the classic environment is marked with "(Classic Only)"; information that only applies to remote debugging applications running in the Mac OS X environment is marked with "(Mac OS X Only)"; and information that applies to both is not marked.
This section assumes that you have an existing CodeWarrior Mac OS project that you wish to use for remote debugging. If you do not have such a project, create one before continuing.
Here are the topics in this section:
The remote system should have a couple pieces of software installed before you can debug the remote application. You also need to set up a remote connection entry for the remote system in the CodeWarior IDE preferences.
1. Install the MetroNub extension (Classic Only).
TheMetroNub extension is installed on the local system by the
CodeWarrior installer. It is located in the Extensions folder of the System Folder on the local system. Copy this extension to the remote system's
Extensions folder.
2. Install the remote debugger nub application.
If the application you are debugging is running in the classic
environment, you will need to install the MetroNub Remote application on the remote system. This application is located
on the local system in the Other Metrowerks Tools folder. Copy this application to any place on the remote system.
We will run this application later in this section as part of
the debugging process.
If the application you are debugging is running in the Mac OS
X environment, you will need to install the DebugNubController.app application on the remote system. This application is located
on the local system in the System:Developer:Applications folder. Copy this application to any place on the remote system.
We will run this application later in this section as part of
the debugging process.
3. Create a Remote Connection in the CodeWarrior IDE.
Create a remote TCP/IP connection entry in the CodeWarrior IDE Remote Connections preference panel on the local system. The IP address of th entry should be the IP address of the remote system. For detailed information on creating remote connection entries, refer to the IDE User Guide.
Now we will start the remote debugging session in the CodeWarrior IDE. The IDE will connect to the debugger nub on the remote system, send the application to the specified location, and start the debug session.
1. Launch and configure the debugger nub application.
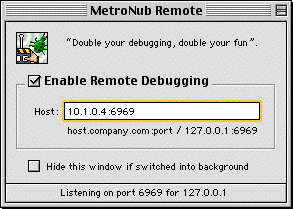
If the application you are debugging is running in the classic environment, launch the MetroNub Remote application (Figure 13.1). This application is responsible for connecting to the CodeWarrior debugger on a specified port.
a. Check the Enable remote debugging box.
This enables remote debugging on the remote system.
b. Supply the IP address of the local system
This is the local system's IP address. The MetroNub Remote application only accepts debugger connections from one system
at a time.
c. Specify the TCP/IP port that you wish to use for debugging.
If no TCP/IP port is specified, the default port of 6969 is used..
If the application you are debugging is running in the Mac OS X environment, launch the DebugNubController.app application (Figure 13.2). This application is responsible for connecting to the CodeWarrior debugger on a specified port.
DebugNub Controller application: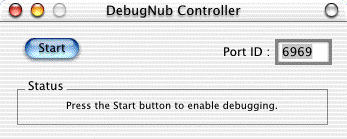
a. Specify the TCP/IP port that you wish to use for debugging.
If no TCP/IP port is specified, the default port of 6969 is used..
This enables remote debugging on the remote system.
2. Open the project on the local system.
Open the project in the CodeWarrio IDE on the local system by
choosing File > Open and selecting the project file, or by double-clicking the project
file.
3. Enable debugging on the local system.
Choose Project > Enable Debugger to enable the debugger. Also ensure that the file you want to
debug has a mark next to it in the debug column of the project
window.
4. Enable remote debugging on the local system.
a. Open the Target Settings Window.
Choose Edit > TargetName Settings to open the Target Settigns window (where TargetName is the name of the target you wish to debug). The Target Settings window is displayed.
b. Display the Remote Debugging settings panel.
Select Remote Debugging in the Target Settings Panels list on the left side of the window. The Remote Debugging settings panel is displayed (Figure 13.3).
Check the Enable Remote Debugging box to enable remote debugging.
Remote Debugging settings panel: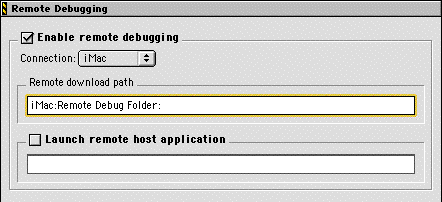
 NOTE
NOTE In CodeWarrior Professional Release 6, it is also necessary to restart the IDE to activate the new state of the Enable Remote Debugging setting. Each time you toggle this checkbox, you must restart the IDE for the change to take effect. This will be fixed in future versions of the IDE.
d. Select a remote connection entry.
Choose from the Connection pop-up menu the name of the remote connection that corresponds to the remote system. This pop-up menu contains an item for each entry in the Remote Connections preference panel.
e. Set the remote download path.
Enter into the Remote download path edit field the full path of the folder where you want the application to reside on the remote system. Be sure that this path points to an existing folder on the remote system. The application is automatically transferred to this location before being debugged.
NOTE If the remote application is running in the classic environment,
use a Mac style path (for example, "MacintoshHD:MyApp:"). If the remote application is running in the Mac OS X environment,
use a UNIX style path (for example, "/var/temp/".
f. Set remote host application (optional).
If the executable you are debugging is a code resource or requires a host application to run, check the Launch remote host application box and specify the path to the host application in this edit field.
5. Restart the CodeWarrior IDE on the local system.
Restart the IDE to switch from "local debugging" mode to "remote debugging" mode.
6. Start the debugger on the local system.
Choose Project > Debug on the local system to initiate the debug session. The IDE transfers the application to the remote system (Figure 13.4) and starts a new debug session.
Copying the application to the remote system: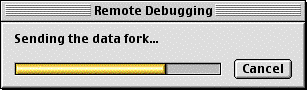
In addition to the normal debugger program window, a debugger log window is diplayed showing each step of the process.
In this section we discuss various aspects of debugging C++ and PowerPlant code. The topics in this section include:
When the Attempt to use dynamic type of C++, Object Pascal and SOM objects option is enabled in the Display Settings IDE Preferences panel, the debugger helps you debug C++ objects, including PowerPlant objects. You can declare in your source code that an object belongs to a certain base class, but the actual object at runtime may be a member of some subclass. The debugger dynamically recognizes the runtime class of an object and displays it with its true class, rather than as an object of the declared class.
void
LBroadcaster::BroadcastMessage(

	MessageT					inMessage,

	void					*ioParam)
{
	if (mIsBroadcasting) {
		TArrayIterator<LListener*>	iterator(mListeners);
		LListener *	theListener;

		while (iterator.Next(theListener)) {
			if (theListener->IsListening()) {
				theListener->ListenToMessage(inMessage, ioParam);
			}
		}
	}
}
Consider the example shown in Listing 13.1, taken from the PowerPlant class LBroadcaster. The local variable theListener has a declared type of LListener*. If you are stepping through this routine at runtime, this object will certainly be an instance of some subclass, such as LDialogBox, LRadioGroup, or a subclass of your own. The debugger determines the object's actual class and automatically casts it to that type. You can then see all of the object's data members and easily pick out which instances you want to trace further.
If you choose Data > Show Types from the CodeWarrior menu bar during a debug session, the object's runtime type appears in the Variables pane of the Thread window as well. C++ reference variables and parameters are displayed in debugger windows as pointer types, because that is how they are stored in the SYM file.
new Objects created via the C++ new operator are heap-based. After
allocating space in the heap for the new object, the new operator
calls the object's constructors in a specified order. If the new
object has data members that are also objects, the member objects
are also created via the new operator. Table 13.1 lists the sequence of events that occur when initializing a heap-based
object.
Sequence of execution for creating heap-based objects:
When using the library version of the new operator, correspondence between the SYM file and your source
code is not available. If you step into the new operator under these circumstances, step through it in the assembler
view or use the Step Out command. On the other hand, if the source code for the new operator is included in the project, you can step into and trace
through the new operator.
NOTE If the Don't Step Into Runtime Support Code setting is enabled in the Global Settings preference panel and no source code is available from the SYM file, the CodeWarrior debugger skips these routines.
After the new operator completes execution, you can step into the object's
constructors (steps 2, 3, and 4 in Table 13.1). You can step through all constructors, whether called explicitly
or implicitly. To step through a series of constructors, use the
Step Into command repeatedly while the current-statement arrow is at the
first line of the constructor, just as if there were multiple
function calls on that line.
NOTE Synthesized constructors do not have source correspondence, because there is no source code associated with them.
Listing 13.2 shows some example code that we'll use to demonstrate how to
step into a series of constructors. If you begin debugging from
the statement in main() that allocates b (using the new operator), the following sequence occurs:
1. Using the Step Into command goes to the new operator.
When the new operator returns, the current-statement arrow returns to the
line in main() where b is allocated.
2. Using Step Into again gets you into the constructor for B, at the first line in B::B().
3. Continuing to use Step Into gets you into the constructor for B's base class, A::A().
When it returns, Step Into brings the current statement arrow to the A data member.
4. When the A constructor is done, you can continue using Step Into through the B constructor.
Stepping through heap-based objects:
	class A
	{
		public:
			A();
	};
	class B : public A
	{
		public:
			B();

			A myA;				// Contrived example: B derives
							// from A and has a member A.
	};

	void main()
	{
		B* b = new B;
	}

	A::A()
	{
		...
	}

	B::B()
	{
		...
	}
Static objects are objects that are declared as global or static variables. If such an object has a constructor, the constructor is executed before entering the program's main routine. Since, by default, the debugger launches your application and stops it at the beginning of your main routine, static constructors have already run by the time you get control.
To prevent the automatic execution of static constructors, deselect
the Automatically Launch Applications When SYM File Opened setting in the Global Settings preference panel. This allows you to set breakpoints as desired
in any static constructors before launching your program using
the Project > Debug command.
 TIP
TIP You can also prevent static constructors from running automatically by hold down the Option key as the SYM file is being opened.
Static destructors execute after the program's main routine ends, so you can step through them by simply setting breakpoints in the normal way.
When you are debugging an application written with PowerPlant, add the source code files to your project instead of the PowerPlant libraries or PowerPlant subprojects. Using the PowerPlant source code files lets you view PowerPlant methods at the source level instead of the assembler level.
When your application is ready to ship, you can speed compilation and link times, test, and ship the final version of your application with the PowerPlant libraries, or by using the PowerPlant project files as subprojects. Be sure to test your application thoroughly if you use the libraries or subprojects instead of the source code.
To learn more information about subprojects, refer to the IDE User Guide documentation.
The CodeWarrior linker can generate SYM information for code that comes from a file other than the main source file, such as a header file. Because inline functions are typically defined in a header file, this means you can debug inline functions when they are not actually inlined.
To debug inline functions, go to the C/C++ Language target settings panel and set the Inline Depth pop-up menu to Don't Inline. The compiler will treat the inline function as if it were a
regular function, and the linker will generate SYM information
for it. Because SYM information is available, you can debug the
function like any other. When you are through debugging, you can
turn the Don't Inline preference off so that the compiler will actually generate inline
code.
Even if you designate a function as inline and have turned off
the Don't Inline preference, the compiler may still ignore your request and not
inline the function. CodeWarrior C++ inlines a function only if
it satisfies all of the following conditions:
inline keyword.
return statement.
¯ is at the statement level, or
¯ is at the expression level and the function contains no control
statements (such as if, while, for, or switch).
If the inline function is actually inlined, there is no source-code correspondence information for the function in the SYM file. You can step through the code in assembler view, but you cannot see the original source code that defined the function.
For more information on when the compiler does and does not inline a function, refer to the C Compilers Reference.
NOTE Consult the release notes for the CodeWarrior compilers and linkers for any late-breaking news on this topic.
Under normal circumstances, you cannot debug the member functions of an object derived from a template class. However, you can get around this limitation if you specialize on the template class. Specializations are allowed in C++ to allow for the possibility of doing particular optimizations in template methods, depending on the data type.
You can take advantage of this feature to specify a specialized
data type based on the template class. For example, if the short data type makes sense, define a short version of your template class, such as Listing 13.3.
void MyTemplateClass<short>::MyFunction(short myData)
{

	...
}
When you call MyTemplateClass::MyFunction() with a short parameter, the debugger can see your code and allows you to stop
there. When you are finished debugging your code, you can throw
away the specializations (assuming you aren't actually using them
for special cases).
The CodeWarrior Debugger provides direct support for debugging C++ exceptions. To activate this feature, choose Debug > Break on C++ Exceptions from the CodeWarrior menu bar during the debug session.
It is possible to debug code that has calls to the profiler in it. However, the profiler does interfere with stepping through code. You may find it simpler to debug non-profiled code, and profile separately. In this section you'll learn what happens when you step into a profiled routine and step out of a profiled routine. Information about the effect that stopping in the debugger has on the profile results is also presented here. For more information on the profiler, refer to the Profiler Manual.
If you step into a profiled routine, you'll see assembly code instead of source code. The compiler has added calls to __PROFILE_ENTRY at the start of the routine. This is how the profiler knows when to start counting time for the routine.
If you step through the assembly code far enough to get to the code derived from the original source code, then switch the view from source to assembly and back again, you can see the original source code.
If you single-step out of a routine being profiled, you end up in the __PROFILE_EXIT assembly code from the profiler library. This is how the profiler knows when to stop counting time for the routine.
If you stop in a profiled routine, the profiler counts all the time you spend in the debugger as time that routine was running. This skews the results.
 WARNING!
 If you debug profiled code, you must be careful not to kill the
code from the debugger. Remember, if you have called ProfilerInit() you must call ProfilerTerm() on exit or you may crash the computer. Before using the profiler
and debugging profiled code, read the Profiler Manual.
You can use the debugger to debug dynamically loaded, disk-based shared libraries-those loaded with the GetDiskFragment() and GetSharedLibrary() operating-system calls. You can also debug shared libraries when no SYM file is available for the application, as is the case with shared library plug-ins.
The topics discussed in this section are:
There are three limitations on debugging shared libraries:
'cfrg' resource.
This section discusses debugging a shared library using two different methods:
1. Make sure the shared library file has a matching SYM file.
As with applications, a shared library's SYM file must have the
same name as the shared library, plus the PowerPC extension .xSYM. For example, the file could be name MyShlib.xSYM.
2. Enable the IDE debugger and open the shared library's .xSYM file.
3. Set a breakpoint somewhere in the shared library's source or assembly code.
4. Launch the application that calls the shared library.
If you have a .xSYM file for the application, open that file and the application
will be launched in the usual way.
If you do not have a .xSYM file, launch the application in the Finder while holding down
the Control key. The Control key notifies the debugger when the application is loaded; you
can release it as soon as you see the debugger come to the foreground
to open a process window for the new application.
It is not strictly necessary to open the .xSYM files for all your shared libraries before launching the application.
If you open the .xSYM file for a shared library that is in use by an application already
being debugged, the debugger will connect the .xSYM file to the shared library and allow it to be debugged.
1. Make sure the shared library file has a matching SYM file.
As with applications, a shared library's SYM file must have the
same name as the shared library, plus the PowerPC extension .xSYM. For example, the file could be name MyShlib.xSYM.
2. Enable the IDE debugger and open the shared library's .xSYM file.
3. Set a breakpoint somewhere in the shared library's source or assembly code.
4. Launch the application that calls the shared library.
If you have a .xSYM file for the application, open that file and the application
will be launched in the usual way.
If you do not have a .xSYM file, launch the application in the Finder while holding down
the Control key. The Control key notifies the debugger when the application is loaded; you
can release it as soon as you see the debugger come to the foreground
to open a process window for the new application.
It is not strictly necessary to open the .xSYM files for all your shared libraries before launching the application.
If you open the .xSYM file for a shared library that is in use by an application already
being debugged, the debugger will connect the .xSYM file to the shared library and allow it to be debugged.
There are many different types of code resources. The CodeWarrior
debugger can debug many of them, but not all. Examples of types
for which the debugger is known to work include PhotoShop plug-ins,
Quark XTensions, 'XCMD' resources, and 4D extensions.
This section discusses the following topics:
There are some requirements you must meet if you wish to debug a code resource.
If you meet these requirements, the code resource can be single- or multi-segment. If it is a 68K project, you can use A4 or A5 globals, depending upon the needs of your project.
At runtime, the code resource being debugged must meet certain conditions:
() function. Otherwise the debugger may be unable to display your
global variables, or may display them with incorrect values. It
is advisable to read through the A4Stuff.h and SetUpA4.h header files.
'MDEF'-a menu definition function. If you stop at a breakpoint in the
'MDEF', the Menu Manager is in an undefined state because it was in
the middle of carrying out a request when the breakpoint was hit.
If you then do anything while stopped that uses the Menu Manager,
the operating system may crash.
Use the following instructions to debug a code resource.
1. Make sure the debugger properly matches the SYM file to the code resource.
For example, a project creates a code resource, places it in a
file named MyCodeRes, and generates a corresponding SYM file. The debugger targets
the file MyCodeRes as the executable file. If the debugger can't find MyCodeRes, it will prompt you to locate the executable file. Select the
file containing the code resource, which may be in its own file
or in another file such as an application.
2. Enable the IDE debugger and open the code resource's SYM file.
3. Set a breakpoint in the code resource's source or assembly code.
Ideally, place a breakpoint at the code resource's entry point, so that the debugger will get control as soon as the code resource is called.
4. Run the program that calls the code resource.
Launch the host program that calls the code resource as you would normally. When the host program calls your code resource, the debugger takes control. You can then debug the code resource. For example, to debug a typical application plug-in, launch the application and issue the command that calls your plug-in.
TIP You can also have the IDE launch the application for you. See "Debugger Settings" for more info
TIP If you are debugging a code resource as well as its host program, you can have browser windows for both. With multiple SYM files open, you can debug your application and the code resource simultaneously, or even debug multiple code resources.
The IDE debugger supports the Macintosh Thread Manager. The task pane of the Process window displays a list of current threads and allows you to view the call chain, variables, and source code of any thread.
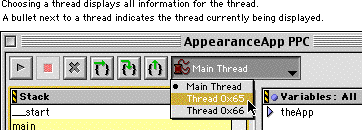
The threads pop-up menu lets you view the call chain, variables, and source code of any thread running under the Thread Manager (Figure 13.5). All the panes in the stack crawl window update when you switch threads.
The threads pop-up menu is only available if the Show tasks in separate windows preference has been turned off in the Display Settings panel.
NOTE As with other low-level code, the debugger cannot debug 68K preemptive threads.
There is an important distinction to be made between cooperative threads and preemptive tasks or threads. Under the Mac OS Thread Manager, threads are usually cooperative. It is also possible to write code using preemptive threads on 68K Mac OS computers, but not on Mac OS PowerPC computers.
NOTE Apple no longer supports preemptive threads with the Thread Manager.
When you stop in a cooperative task under the Mac OS (due to a breakpoint, step or some sort of exception) all other cooperative tasks are also stopped. Similarly, when you resume a cooperative task (step or run) all the other cooperative tasks are also resumed.
However, this is not the case of preemptive tasks (which currently only appear on multi-processor computers or when using 68K preemptive threads). Preemptive tasks can be suspended and resumed completely independently of each other and of the cooperative tasks.
To learn more information on this topic, consult the IDE User Guide for more information. You may also wish to consult Apple Thread Manager SDK, available on the Apple Developer CD subscription from Apple Computer.
The CodeWarrior debugger gives you direct support for debugging System Object Model (SOM) objects. You use SOM objects when writing an OpenDoc part.
To debug code with SOM objects, select the Attempt to use dynamic type of C++, Object Pascal and SOM objects checkbox on the Display Settings preference panel in the IDE Preferences dialog box. To enable the IDE Preferences dialog, choose Preferences from the Edit menu in the IDE.
To learn more on this topic, or to learn about how to change debugger preferences, refer to the IDE User Guide.
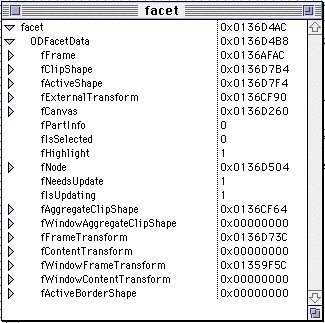
You can view a SOM object in the variable pane, or you can double-click the variable to see its contents in a separate window. Figure 13.6 shows a SOM object variable expanded in its own window.
Note that the facet variable has an ODFacetData structure embedded
inside. In C++, when you look at the contents of an object, you
see all the data members listed as belonging directly to the object.
Data members inherited from base classes are mixed in with other
data members. SOM stores inherited data members from each base
class in the hierarchy separately within the object. So, assume
you have an ODFrame object that inherits from this hierarchy:
SOMObject -> ODObject -> ODRefCntObject -> ODPersistentObject -> ODFrame.
When you look at the object in the debugger, it looks like Figure 13.7. You have the data members from ODRefCntObject, ODPersist-entObject, and ODFrame listed separately. The SOMObject and ODObject don't appear because they have no data members.
Frame variable in its own window: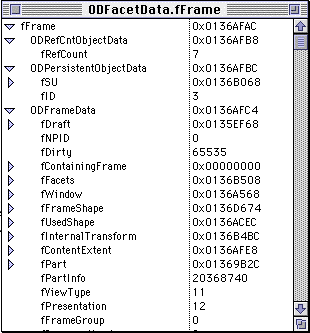
NOTE SOM adds "Data" to the structure name for the inherited class it represents.
So, the class ODFrame becomes ODFrame-Data in Figure 13.7.
DebugNew is a C++ source code library you can add to your C++
or PowerPlant projects to help you find memory problems. DebugNew
replaces the standard new and delete operators as well as the array allocation/deallocation operators
new[] and delete[].
DebugNew provides the following services:
NEW instead of new in your source code.
This section discusses the following topics:
Setting Up DebugNew Using DebugNew Leaks.log
The DebugNew source files are installed automatically by the CodeWarrior
Installer. DebugNew is installed in Metrowerks CodeWarrior:MacOS Support:DebugNew.
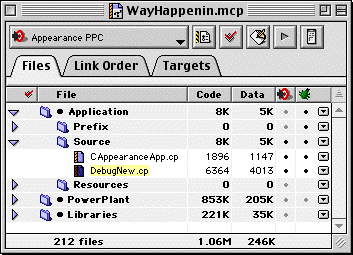
DebugNew is easy to setup. First, add DebugNew.cp to your current C++ or PowerPlant project, as shown in Figure 13.8. Next, you include the following line of code in every source
file in your project:
#include<DebugNew.h>
The best method is to use a prefix file or precompiled header file. The method you use depends on the size of the project. If your project is small, use a prefix file in the C/C++ Language preference panel. If your project is large, like a PowerPlant project, use your own precompiled header file in the C/C++ Language preference panel.
To learn more about how to use precompiled header files, refer to the IDE User Guide documentation on the CodeWarrior CD.
This section discusses, in more detail, how to setup your prefix or precompiled header file to use DebugNew for your project. DebugNew provides the following two modes of operation: basic and leak detection. The leak detection mode is described in this section.
By default, DebugNew only works for global operator new. However, if your class-specific operator new calls the global operator new, then those allocations will be tracked.
DebugNew does not attempt to do anything when allocation fails.
That is what DebugNewSetErrorHandler() is for. Refer to "Advanced Techniques" for more information.
Errors are reported in two ways. When a validation check occurs
at runtime, an error handler routine is called. The default routine
just issues a DebugStr() call with a diagnostic message. If you prefer different behavior,
you can provide your own error handler by calling DebugNewSetErrorHandler(). Validation errors occur when operator delete is called, or when your code calls DebugNewValidatePtr() or DebugNewValidateAllBlocks().
Because DebugNew uses DebugStr() traps, you should have a low level debugger such as MacsBug installed
on your system, or run your program in the IDE debugger with appropriate
preferences set. For more information on DebugStr() traps, refer to "Mac OS Debugger Traps".
To enable full leak checking, you must #include <DebugNew.h> in every source file in your project, set up DebugNew's leak
detection mode, and finally, replace every non-array usage of
global operator new to use the macro NEW. This is best achieved by using a prefix or precompiled header
file with some preprocessor directives.
Three constants (DEBUG_NEW_OFF, DEBUG_NEW_BASIC, and DEBUG_NEW_LEAKS) are defined for the purpose of turning DebugNew on and off.
To enable leak protection, you will set the DEBUG_NEW preprocessor variable to the DEBUG_NEW_LEAKS constant.
Place the source code in Listing 13.4 at the top of your prefix or precompiled header file.
#define DEBUG_NEW DEBUG_NEW_LEAKS //enable leak detection
#include <DebugNew.h>
#define Debug_Version 1  // App is a debug version

#if Debug_Version
   #define new NEW  // use DebugNew's NEW macro
#endif
NOTE The Debug_Version preprocessor variable, used throughout the examples, is not necessary
to use DebugNew. However, it is good programming practice to conditionalize
your debugging code.
WARNING! Use #define new NEW at your own risk because the compiler's preprocessor will indiscriminately replace every instance of new with NEW. This could cause undesirable side effects to occur. If you wish to use DebugNew's leak checking capabilities, it is recommended that you manually replace each instance of new you wish to track in your code with NEW. See the DebugNew Demo on the Reference CD for more information.
You can disable DebugNew by changing two lines as follows:
#define DEBUG_NEW DEBUG_NEW_OFF //disable DebugNew
#define Debug_Version 0  //App is not debug version
Using this method, you can continue to use DebugNew throughout the development cycle, turning it on or off as required, and then disable it (or remove it completely) for your final build.
Memory leaks are reported via the file "leaks.log". This file
is written to the application's directory whenever DebugNewReportLeaks() is called. This call should be the last statement in main(), before your application exits, as shown in Listing 13.5.
//================================================================
//		· main
//================================================================
//	Do application initialization, create the application object,
//	and run the main event loop.
void main()
{

	// Initialize memory and toolbox.
	InitializeHeap(5);
	UQDGlobals::InitializeToolbox(&qd);

	// Set up grow zone.
	LGrowZone grow(20000);

	// Bracket here so DebugNew can catch application-level leaks.
	{
		CTestApp  theApp;
		theApp.Run();
	}

	// If debugging, it's time to report on leaked C++ objects.

	#if Debug_Version

		DebugNewReportLeaks(); // dump leak info to leaks.log file

	#endif

}
Compile and run your program, performing various operations that you would do in a normal test cycle. When you quit your program, the leaks.log file will be created for you to examine.
The leaks.log file provides useful information on where leaks are occurring in your code. Listing 13.6 shows a normal leaks.log file.
Maximum #bytes allocated at any point via operator new: 141284
There are 6 memory leaks, totaling 136 bytes:
  LComparator.cp line: 76, size: 4
  LDragAndDrop.cp line: 418, size: 40
  LPeriodical.cp line: 124, size: 40
  LComparator.cp line: 116, size: 4
  <unknown>, size: 40  // array
  LApplication.cp line: 134, size: 8
The leaks shown in Listing 13.6 are memory allocations that are only deleted upon quitting the application. These leaks are normal. If, however, leaks.log is a large file showing many leaks, then there is a serious problem you need to fix.
The file name and line numbers are provided by DebugNew's leak detection mode. Leak checking imposes a 24 byte overhead to each allocated block. There is also the overhead of finding and removing each block from the block list when it is deleted. The memory and time hit will be noticeable on moderate to large programs. Leak testing should generally only be enabled periodically to clean up leaks, and then turned off again.
TIP Use MW ZoneRanger along with DebugNew to get more information on how your program is allocating and deallocating memory. To learn more about ZoneRanger, refer to the CodeWarrior ZoneRanger Manual on the CodeWarrior CD.
One of DebugNew's more advanced features is the ability to install
your own error handler. You can then handle various errors however
you want. To install your own error handler, call DebugNewSetErrorHandler() as shown in Listing 13.7.
// Replace DebugNew's error handler.

	#if Debug_Version
		DebugNewSetErrorHandler(BetterDebugNewErrorHandler);
	#endif
Then you actually write your own error handler. The best method of doing this is to copy DebugNew's error handler into your own source file to use it as a shell. You then write code to expand on each condition you wish to handle. Listing 13.8 shows an example error handler you could write using PowerPlant's Debug_Signal mechanism.
A different error handler for DebugNew:
	// ------------------------------------------------------------
	//		· BetterDebugNewErrorHandler
	// ------------------------------------------------------------
	//	A replacement for DebugNew's error handler. Makes it easier to
	//	identify the cause of the error in the debugger.
	void BetterDebugNewErrorHandler(short err)
	{
		switch (err) {
			case dbgnewNullPtr:
				SignalCStr_("DebugNew: null pointer");
				break;

			case dbgnewTooManyFrees:
				SignalCStr_("DebugNew: more deletes than news");
				break;

			case dbgnewPointerOutsideHeap:
				SignalCStr_("DebugNew: delete or validate called for pointer outside application heap");
				break;

			case dbgnewFreeBlock:
				SignalCStr_("DebugNew: delete or validate called for free block");
				break;

			case dbgnewBadHeader:
				SignalCStr_("DebugNew: unknown block, or block header was overwritten");
				break;

			case dbgnewBadTrailer:
				SignalCStr_("DebugNew: block trailer was overwritten");
				break;

			case dbgnewBlockNotInList:
				SignalCStr_("DebugNew: block valid but not in block list (internal error)");
				break;

			case dbgnewFreeBlockOverwritten:
				SignalCStr_("DebugNew: free block overwritten, could be dangling pointer");
				break;

			default:
				SignalCStr_("DebugNew: undefined error");
				break;
		}
	}