This chapter explains how to configure the CodeWarrior IDE to effectively debug Mac OS code using the CodeWarior source-level debugger.
These are the primary topics discussed in this chapter:
For more advanced Mac OS debugging topics, see "Advanced Mac OS Debugging".
Refer to the IDE User Guide for more detailed information on the debugger and debugger settings.
Refer to Targeting Win32 if you are interested in configuring the Mac OS-hosted IDE to debug Windows software.
You can use the CodeWarrior IDE to debug your Mac OS code as part of a normal development cycle: edit the source code, compile the software, then execute and debug the software.
This section discusses the following topics:
This section discusses the requirements for using the CodeWarrior debugger on your machine. The topics in this section include:
In order to use the remote debugging facilities in the CodeWarrior IDE, you must have Open Transport 1.1 (or later) installed.
To use the CodeWarrior IDE to debug your code on Mac OS, certain
system extensions must be installed on the Macintosh running the
IDE. These system extensions must be installed in the Extensions folder of your System folder. The CodeWarrior installer automatically
installs these extensions into your Extensions folder during installation
of the CodeWarrior package. When you install or remove these system
extensions, you must restart your computer for the changes to
take effect.
Before using the debugger, make sure that the MetroNub extension is installed on the system running the debugger. If you are doing remote debugging, we recommend that you also install MetroNub on the remote system.
MetroNub is the CodeWarrior debugger nub - a system extension that provides low-level services allowing the CodeWarrior debugger to control software execution. This extension allows you to debug any kind of object code created by the CodeWarrior environment.
The MetroNub extension supports multiprocessor Macintoshes.
 WARNING!
 Earlier versions of CodeWarrior's standalone debugger (MW Debug) used Apple's DebuggerINIT and Power Macintosh Debug Services nubs when running under System versions earlier than 7.5. These debugger nubs are no longer supported; you must use MetroNub for all debugging.
If you are doing remote debugging over a network to a different
machine, you will also require a copy of the MetroNub Remote application. This application is normally installed by the CodeWarrior
installer into the Other CodeWarrior Tools folder in your CodeWarrior folder.
If you are doing remote debugging, you do not need the MetroNub extension; but it will not hurt to leave it on your system.
After installing the software, be sure to restart your computer so the software will be loaded correctly. You will not be able to use the debugger facilities until the required software is loaded.
There are many settings in the CodeWarrior IDE pertaining to debugging. This chapter only deals with the debugger settings that relate to debugging Mac OS software. For information on general debugger settings, refer to the IDE User Guide.
There is only one settings panel directly related to debugging
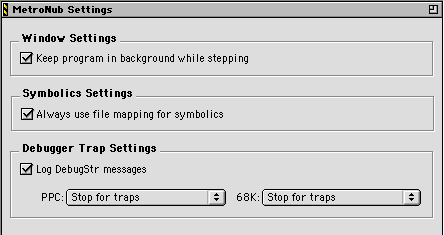
Mac OS software. The MetroNub Settings panel, shown in Figure 12.1, contains settings that determine how the CodeWarrior IDE interacts
with the MetroNub debugger nub and the Mac OS software being debugged.
MetroNub Settings preference panel:
The items in this settings panel are:
The Keep program in background while stepping checkbox allows you to step through a program's code while the program is running in the background, without bringing the program to the foreground during each step. This makes stepping faster and avoids screen flicker resulting from the program's windows flashing to the front and then back again each time you step.
WARNING! This option may affect the execution of your program if the program behaves differently in the background than in the foreground.
The Always use file mapping for symbolics checkbox determines whether MetroNub or the IDE handles symbolics files. Enable the checkbox to let MetroNub handle the files. Disable the checkbox to let the IDE handle the files.
These settings determine how the debugger handles Debugger() and DebugStr() traps during program execution.
When the Log DebugStr messages box is checked, the IDE keeps a log of all messages that you
emit from your code with the DebugStr() system call. The log is displayed in a CodeWarrior text window
while the code is running.
The PPC and 68K pop-up menus in this section of the panel allow you to instruct the IDE how it should handle PowerPC and 68K debugger traps.
If MacsBug handles traps is selected, the IDE passes control to the installed low-level debugger (like MacsBug or Jasik) when a trap is encountered.
If Stop for Traps is selected, the IDE will stop program execution whenever a trap is encountered and activate the CodeWarrior debugger facilities, just as if it had encountered an IDE-based breakpoint. This feature allows you to use the CodeWarrior built-in debugger instead of the low-level debuger without having to change your source code.
If Ignore traps is selected, traps will be ignored by both the IDE and the low-level debugger.
 NOTE
NOTE These settings only effect the behavior of traps when the code is running under CodeWarrior IDE / MetroNub control. It is probably not a good idea to leave debugger traps in shipping versions of your software.
For more information about Apple's MacsBug, refer to:
	http://developer.apple.com/tools/debuggers/

	MacsBug/
For more information about Jasik's The Debugger, refer to:
http://www.jasik.com
NOTE The debugger trap settings do not effect the Log DebugStr messages setting. For example, if you instruct the IDE to ignore traps, the debug string is logged without stopping program execution.
See also "Mac OS Debugger Traps" for information on Debugger() and DebugStr().
For general information on the CodeWarrior debugger, refer to the IDE User Guide.
This sections introduces you to some basic concepts for debugging Mac OS source code:
The CodeWarrior IDE allows you to set breakpoints to instruct the debugger to stop at certain lines in you source code. This is done by clicking in the breakpoint column next to the line of code you want te debugger to stop at.
It is also possible to embed in your code Mac OS Toolbox calls
designed to invoke the low-level debugger. These Mac OS Toolbox
calls are Debugger() and DebugStr(). These toolbox calls stop the code's execution and invoke the
installed low-level debugger.
WARNING! If a low-level debugger is not installed, these calls may cause your machine to crash or exit unexpectedly. This is true even if the CodeWarrior IDE is running.
The Debugger() toolbox call simply halts code execution, and drops into the
low-level debugger. Listing 12.1 shows an example of MacsBug output generated by the Debugger() toolbox call.
Example MacsBug Debugger() output:
User break at 2E538488 main+00018
The DebugStr() toolbox call does a little more. This call takes a pascal-style
string as a parameter. When encountered, code execution is halted,
and the string is displayed in the low level debugger. Listing 12.2 gives an example of MacsBug output generated by a call to DebugStr("\pthis is a test.");.
Example MacsBug DebugStr() output:
User break at 2E538494 main+00024
 this is a test.
You can also use the Debugger Trap Settings in the MetroNub Settings preference panel to instruct the CodeWarrior debugger to intercept debugger traps. This allows you to use the CodeWarrior built-in debugger instead of the low-level debuger without having to change your source code. See "Debugger Trap Settings" for more information on these settings.
NOTE The Debugger Trap Settings in the MetroNub Settings preference panel only effect the behavior of traps when the code is running under CodeWarrior IDE / MetroNub control. It is probably not a good idea to leave debugger traps in shipping versions of your software.
Another setting in the MetroNub Settings preference panel, Log
DebugStr messages, logs DebugStr() output allowing you to keep a running record of DebugStr() messages as they are encountered in your code. See "Debugger Trap Settings" for more information on this setting.
MacsBug and MacApp allow you to embed low-level debugger commands
into the string you supply in the DebugStr() call. All characters following the ";" character (a semicolon) in the string are interpreted by the
low-level debugger as commands. For example, to view the contents
of a pointer variable, you might do something like Listing 12.3.
NumToString(myPtr, myPtrString);
DebugStr(';dm @#' + myPtrString);
 TIP
TIP Because "g" is the debugger command for "Resume execution", strings ending
with the characters ";g" cause the code to continue executing. This is a good way to
log messages without stopping your code.
See also "Other MetroNub Settings" and the for more details on the Log Window and debugger preferences.
You can start the CodeWarrior debugger by dropping a SYM file
on the IDE icon or by double-clicking a SYM file. You may also
start the CodeWarrior debugger by choosing File > Open from the CodeWarrior menu bar and locating a SYM file.
In summary, there are three methods you can use to start the CodeWarrior debugger:
File > Open from the CodeWarrior menu bar and locate the SYM file.
These methods do not require that the project be open in the IDE,
and allows you to use the same method of debugging used in previous
versions of the IDE, where the debugger was a stand-alone application.
While these are both valid methods of initiating a debug session,
they are not preferred. Instead, we suggest you choose Project > Debug from the CodeWarrior menu bar to start the CodeWarrior debugger.