This chapter covers only those aspects of debugging that are specific to the Win32/x86 platform; refer to the IDE User Guide for basic information on operating the integrated debugger.
This chapter includes the following topics:
The CodeWarrior® debugger requires symbolic information in order
to operate. The CodeWarrior back-end compiler for x86 processors
can generate this information in either of two formats: SYM or
CodeView. The choice is determined via project settings in the
x86 Processor and x86 Linker settings panels; see "x86 Processor" and "x86 Linker" for more information. SYM information is stored in a separate
file called a SYM file; CodeView information is stored in the
object file itself, whether an executable application or a DLL.
Typically, you will want to generate symbolic information for all source files in a project so that the debugger can display high-level source code as you debug. In some cases, however, you may want to disable the generation of debugging symbolics for certain files. You can turn debugging on or off for a file by enabling or disabling its option in the Project window; refer to the IDE User Guide for details.
For more detailed control over which functions within a source
file generate debugging information, you can use the C/C++ sym pragma. Both the Generate SYM File option in the x86 Linker project settings panel and the SYM Format option in the x86 Processor panel must be enabled for this to work. You can then use the
lines
#pragma sym on
#pragma sym off
in your source code to control the generation of symbolic debugging information for specific functions. Refer to the C Compilers Reference for more information.
When you double-click the symbol file of a program, the IDE launches
and automatically runs the program in Debug mode. If your main
entry point is in a module that has debugging information enabled,
the debugger will stop program execution at the main() function so that you can set breakpoints and perform other debugging
tasks. If the main entry point is not in a module with debugging
information, open the Global Preferences panel by choosing Edit > Preferences and disable the Automatically launch applications when SYM file opened option. This gives you a chance to set breakpoints before the program
is run.
Refer to the IDE User Guide for more information on debugger preferences.
You can debug your static libraries normally by linking your application and generating debug symbols, and then setting breakpoints normally in the library code. If your library is set to build as a separate target, verify that you are generating the appropriate debug symbol information necessary for the debugger to function.
When your program includes dynamic link libraries (DLLs), you can also debug those. To debug a DLL, open its symbol file before launching the application. You can set breakpoints in the DLL here, and the debugger will honor them when the application that uses the DLL is run. Before starting the program, make sure the DLL is in the same folder with the program.
 NOTE
NOTE The Mac® OS hosted debugger does not automatically transfer DLLs to your Win32/x86 system. Make sure the DLL is installed there before starting the debugging process.
The debugger is integrated seamlessly with the rest of the CodeWarrior integrated development environment.
This section discusses one specific debugger preference panel:
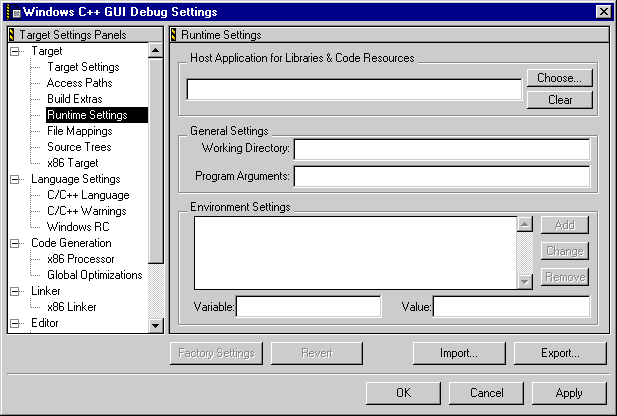
Choose Edit > Target Settings, where Target is the name of the current target. The Target Settings window appears. Select Runtime Settings from the Target Settings Panes area. The Runtime Settings panel appears, as shown in Figure 11.1. This panel consists of three main areas: Host Application for Libraries & Code Resources, Environment Settings, and General Settings.
The Host Application for Libraries & Code Resources field allows you to specify a program executable EXE file to drive your library. Click the Choose button to navigate to the program file, or click Clear to remove any settings in this field.
The General Settings area contains the following fields:
The Environment Settings area allows you to specify environment variables that are set
and passed to your program as part of the envp parameter in the main() or available from the getenv() call, and are only available to the target program. When the
program terminates, the settings are no longer available. For
example, if you are writing a program that logs into a server,
you could use variables for user ID and password.
This area contains the following items that control the IDE environment.
Variable field to the list of environment variables and assign it the
value in the Value field.
Value field.
Variable field.
For additional information about the Runtime Settings panel, see "Runtime Settings."
The Mac OS-hosted CodeWarrior tools include remote debugging capabilities for Win32 applications. This is a two-machine debugger setup that runs on the Mac OS host and communicates with the running application on the target computer via a TCP/IP network connection. This section covers only those aspects of debugging that are specific to the Win32 platform and the remote debugger. Refer to the IDE User Guide for general information on the debugger.
To debug Win32 programs with the Mac-OS-hosted debugger, you must:
The following sections tell how to accomplish these tasks:
Networking the Computers Configuring the Network Software
If both of your computers are connected to a local-area network, you can use the TCP/IP protocol to communicate between them. If you are part of a network that uses TCP/IP, then you are already set up. All you need to make the connection is the TCP/IP address of your Win32/x86 computer. If you are not already networked, set up both your Mac OS system and your Win32/x86 system to communicate via TCP/IP as follows:
TCP/IP control panel to enable and set up TCP/IP. If your network is
not already using TCP/IP, you can choose any address (for example,
1.1.1.1). If your network is already set up for TCP/IP, you must
get a unique address from your network administrator.
Network control panel. Check Installed Network Software and look for TCP/IP Protocol. If TCP/IP is installed, double-click it to configure or to get
the address, which you must have to set up communications. If
TCP/IP is not installed, install it by clicking the Add button. Again, if you were not already using TCP/IP software
on your network, you can choose an address different from the
one you used on the Mac OS side (for instance, 1.1.1.2).
Establishing a communications link between your host and target computers requires some low-level connection software on both the Mac OS and Win32/x86 sides. You must install the needed software and then configure it appropriately for the type of connection you are using.
In order to work for remote debugging, the debugger on your Mac
OS host system requires a few system extensions to be installed
in the Extensions sub-folder of your system folder. The CodeWarrior Installer program
will automatically place these items in your Extensions folder at installation time. Then, before debugging a Win32/x86
project, you must configure the debugger on the Mac OS host for
remote operation. Run the IDE and open the project file you wish
to debug on the Win32/x86 target:
1. Display the Preferences window.
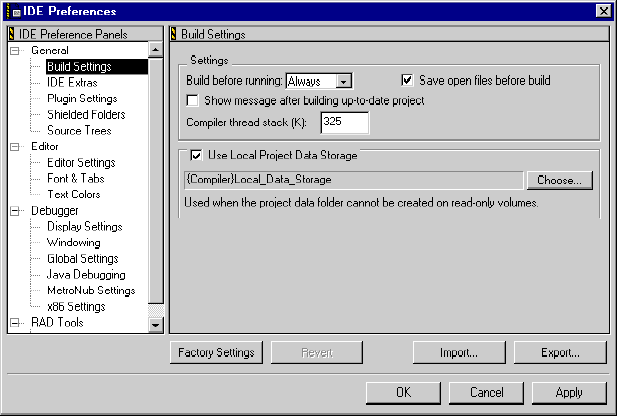
Choose Edit > Preferences. The IDE Preferences window appears, as shown in Figure 11.2.
2. Display the x86 Settings preference panel.
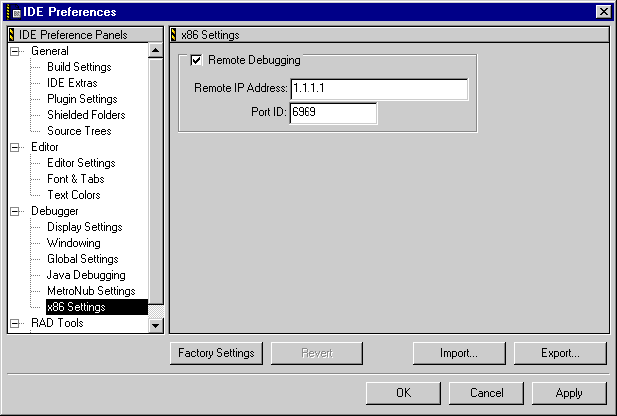
Select x86 Settings from the IDE Preference Panels area. The x86 Settings panel appears as in Figure 11.3.
Enable the Remote Debugging option. This enables TCP/IP for your network connection. Type the IP address of the Win32 machine in the Remote IP Address field, and change the port if required (the same port must be used on each machine and should not conflict with the list of well known Internet ports. Accepting the default of 6969 is wise unless you need to work around a firewall that is blocking that port. Discuss this topic with your network administrator if you have questions.
Click OK to accept your preference settings and close the window. Repeat
this procedure on your Mac OS machine using the IP address of
your Windows® computer.
Run the program MWRemote.exe. It is located in the MWRemote sub-folder of the tools folder within the CodeWarrior install directory. Make sure that TCP/IP is selected in the Connection list-box. The MWRemote icon will appear on the right end of the Windows task bar to indicate that it is running.
6. Start Debugging on the Mac OS system.
Choose Project > Debug. The debugger launches, and automatically copies the Win32 executable
to the Windows machine. Debugging stops at the main entry-point
(main() or WinMain() in most Win32 applications, or at DLLMain() for DLLs).
NOTE If your application uses DLLs, they will have to be manually copied to the remote machine. The debugger will not copy DLLs over.
When debugging code on AMD® processors, many of the same mechanisms apply. You still have to enable debugger support and symbol generation.