This chapter discusses the various windows you see when using ZoneRanger. More detail on how to use ZoneRanger can be found in "Using Zone-Ranger."
Each process usually has its own memory space called a heap zone. ZoneRanger displays detailed information about any heap zone currently active on a Mac OS system. It displays the number and sizes of free blocks, pointers, handles, locked handles, purgeable handles, and resource handles. It can also graphically display a heap zone, with the size, type, and attributes of each block clearly marked.
ZoneRanger has five types of windows:
ZoneRanger updates all windows at an interval you choose. The only exception is the Block List window, whose contents are static.
 TIP
TIP ZoneRanger provides complete balloon help for all menu items, windows, and dialogs. You can view menu item balloons without turning on balloon help. Hold down the Option key as you click in a menu. Zone-Ranger displays balloon help until you release the mouse button.
If ZoneRanger runs low on memory, commands that require additional memory are disabled. To make more memory available, close any unneeded windows.
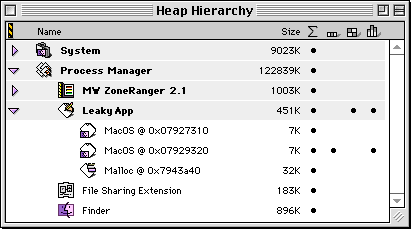
When launched, ZoneRanger automatically displays the Heap Hierarchy window shown in Figure 3.1. This window lists all available processes and the heap zones associated with them. You may display this window at any time by choosing Open from the File menu.
You do not need to close the Heap Hierarchy window after opening a heap zone. Left open, the window will reflect the changes in the heap zones as applications are launched and closed.
The Heap Hierarchy has four columns of bullets that control the presence of the different heap display windows. These bullets are described in Table 3.1.
Heap Hierarchy bullet columns:
| This Bullet |
Opens this display |
|---|---|
"Choosing How Often to Refresh Contents," "Quitting and Relaunching an Application" and "Limitations."
The Summary display shows information on all the blocks in an application's heap.
The Summary Display has two rows of numbers. The first row contains the total number of the blocks of each type. The second row contains the total size of the blocks in bytes. The column headings are described in Table 3.2.
| This Column |
Contains the number or total size of |
|---|---|
To see detailed information about the blocks in a column, double click on that column, ZoneRanger opens a Block List Window.
You can copy all of the information in the Summary Display to the clipboard, or save the same information to a text file.
See also "Block List Window."
Each graphical window displays all the blocks in an application's heap. The name of the window corresponds to the name of the process it is displaying. The function of each of the graphical windows are identical.
This section discusses the following topics:
There is a lot of information displayed in each graphical window. It is important to understand the various parts of the graphical windows in order to use them effectively.
The grey area at the top of the window (Figure 3.3) tells you what percentage of the application's heap you see in the window. This area also tells you resolution and zoom factor you are currently viewing at.
If you select a block in any Graphical window, summary information about that block is shown at the bottom of the window beside the popup menus (Figure 3.4). This information tells you the type of block, its address, size in bytes, and its attributes (if the selected block is a handle). This information can also be found in the Block Information popup menu.
In many ZoneRanger windows, not just the graphical windows, there is a series of up to three icons in the lower left corner of the window. These icons are popup menus that display information about the current zone, selected block (if any), and color or pattern legend. Table 3.3 lists the icons the windows in which they appear.
| Icon (scaled) |
Description |
Available in... |
|---|---|---|
|
||
The rest of the window is a graphical representation of the heap zone for the application under inspection.
See also "Searching for Blocks," "Block Information popup menu," "Zone Information popup menu," and "Changing the Graphical windows' colors."
TIP Switch between the Graphical and Summary views for a heap zone with Command-Tab.
The 1D Graphical Display shows a process's heap zone as contiguous sections that look similar to a stacked bar graph (Figure 3.5). Each block represents a fixed number of bytes in the heap zone. This number is called the resolution. If a block is smaller than the resolution, it occupies less than a square, and may not appear in the window at all. To change the resolution, use the Increase Resolution and Decrease Resolution commands in the Configure menu. If you want to force the resolution to the size of the window, use the Fit To Window command. You cannot set the resolution to less than 8 bytes or more than 1 megabyte per square. The default resolution is 256 bytes.
Each block takes up a certain number of pixels in the window.
To change the size, use the Zoom In and Zoom Out commands in the Configure menu. By default, the each square is 1 pixel by 1 pixel. If the block
size is greater than 1 pixel by 1 pixel, you can see the block
outlines by using the Show/Hide Block Outlines commands in the Configure menu. Outlining helps you get an overall
view of how many blocks are in each heap zone and how large they
are.
Each type of block is drawn with a different pattern (if the window is in monochrome) or color (if the window is in color). By default, ZoneRanger uses color on color monitors and monochrome on monochrome monitors. To change this setting, choose Use Color or Use Monochrome from the Configure menu.
In the default color display, free blocks are green, handles are yellow, and pointers are red. If the display is monochrome, free blocks are white, handles are gray, and pointers are black. To change the colors for the blocks, use the Legend Information popup menu. You cannot change the patterns used in a monochrome display.
See also "Changing the Graphical windows' colors."
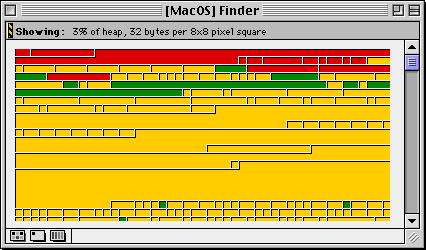
The 2D Graphical Display shows a process's heap zone, wrapped to the width of the window. The display is actually a series of small squares (Figure 3.6).
Each square represents a fixed number of bytes in the heap zone. This number is called the resolution. If a block is larger than the resolution, it spans several squares. If a block is smaller than the resolution, it occupies less than a square, and may not appear in the window at all. To change the resolution, use the Increase Resolution and Decrease Resolution commands in the Configure menu. If you want to force the resolution to the size of the window, use the Fit To Window command. You cannot set the resolution to less than 8 bytes per square or more than 1 megabyte per square. The default resolution is 32 bytes per square.
Each square takes up a certain number of pixels in the window. To change the size, use the Zoom In and Zoom Out commands in the Configure menu. By default, each square is 4 pixels by 4 pixels.
Each type of block is drawn with a different pattern (if the window is in monochrome) or color (if the window is in color). By default, ZoneRanger uses color on color monitors and monochrome on monochrome monitors. To change this setting, choose Use Color or Use Monochrome from the Configure menu.
In the default color display, free blocks are green, handles are yellow, and pointers are red. If the display is monochrome, free blocks are white, handles are gray, and pointers are black. To change the colors for the blocks, use the Legend Information popup menu. You cannot change the patterns used in a monochrome display.
See also "Changing the Graphical windows' colors."
TIP Because of the Graphical windows' visual display, you can easily see which blocks are free or relocatable, and which are not. This is great for discovering heap fragmentation.
In the ideal application heap, all the locked and non-relocatable blocks are tucked away at either end of the heap. There should be one large free block sitting right in the middle of the heap.
Every time you create a non-relocatable block or lock a relocatable block, you put up a barrier in the heap. If this barrier is in the middle of the heap, it causes problems for the Memory Manager. You may have two mid-sized blocks of free memory divided by the immovable block. If there is a memory request bigger than either of your free blocks, the Memory Manager can't meet the request. It cannot put the two free blocks together because the immovable block sits in between. This is heap fragmentation.
By default, ZoneRanger outlines each block in gray. Outlining
helps you get an overall view of how many blocks are in each heap
zone and how large they are. To change whether ZoneRanger outlines
each block, use the Show/Hide Block Outlines commands in the Configure menu.
2D Graphical Display with no outlines: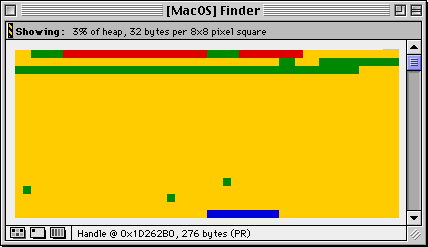
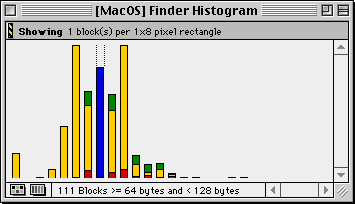
This Histogram Display shows a process's heap as a histogram which
looks similar to a column chart (Figure 3.8). Many of the commands that work with the 1D and 2D Graphical
Displays will work with the Histogram Display. One command that
does not work with the Histogram Display is the Show/Hide Block Outlines command in the Configure menu.
The Histogram Display provides a graphical representation of the number of blocks in the heap zone whose size is in each of the various byte ranges shown in Table 3.4. Each column in the histogram provides a visual indication of what percentage of the blocks in that size range are pointers, what percentage are handles and what percentage are free blocks. Click once on a column to display block information in the status bar at the bottom of the window. Double-click a column in the histogram (or select a column and choose Open Selection from the File menu) in order to open a Block List Window providing a detailed listing of all blocks in that size range.
Byte ranges for Histogram Display:
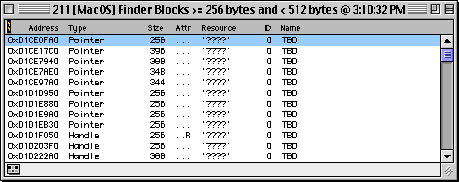
A Block List Window contains a list of related blocks from an application's heap. ZoneRanger creates a Block List Window when you double-click a column in a Summary Display, double-click a column in the Histogram Display, or find a group of blocks with the Find command.
The name of the window is "total type description @ time" where total is the number of blocks in this window, type is the type of heap, description is a brief description of the window's blocks, and time is the time you generated the list.
The name of a Block List Window contains the time to remind you that its contents are not updated, unlike the rest of ZoneRanger's windows. Blocks of memory are transient. All types of blocks can be allocated or deallocated at any time. The list of blocks may be outdated mere seconds after creation. There is a Zone Information popup menu in the lower left corner.
The window contains one row for each block. Each row contains seven fields, described in Table 3.5.
| Field |
Description |
|---|---|
w
You can copy information on the selected blocks to the clipboard with the Copy command or save the information to a file with the Save As Text command.
You can also view the contents of the selected blocks in a Block List window. Either double-click on the selection or choose Open Block @ address from the File menu. ZoneRanger opens a Block Window for each selected block. If the block is no longer valid, the Block Window tells you that the block has been moved or reallocated.
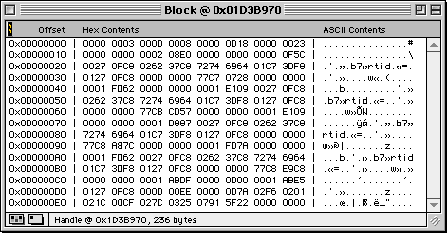
A Block window displays the contents of a block. ZoneRanger opens a Block Window when you double-click on a block in a 1D Graphical Display, 2D Graphical Display, or a Block List Window.
The name of the window is "Block @ address" where address is the address of the displayed block.
Like the Graphical Windows, the Block window has the Zone and Block Information popup menus in the lower left corner. Also, information about the block is displayed at the bottom of the window.
The Block Window contains the entire contents of the block, 16 bytes per row. Each row has three fields, described in Table 3.6.
| Field |
Description |
|---|---|
You can copy or save the displayed portion of the block by choosing Copy from the Edit menu or Save As Text from the File menu. You cannot copy or save the entire contents of the block, unless the block is small enough to fit entirely in the window.
If the window's block moves or is merged with another block, the window displays the message "Block has moved or been reallocated."