Zone-Ranger is a dynamic memory inspection tool that allows you to study how any process-especially one you are creating-uses memory.
This chapter discusses the following topics:
Along the way you'll encounter several tips on how you can use Zone-Ranger to accomplish useful tasks. With Zone-Ranger you can see how to go about:
Finding Memory Leaks deciding if you are fragmenting memory seeing if you're using memory efficiently finding memory-related bugs Quitting and Relaunching an Application without having to reopen the heap in Zone-Ranger.
 NOTE
NOTE You can use Zone-Ranger alone, or in combination with the other developer tools available for debugging memory usage. Among the available tools are QC from Onyx Technology, the DebugNew library for C++ code (part of the CodeWarrior package), and the "leaks" dcmd for MacsBug. This list is not comprehensive.
You can view a process's heap in two ways: in a Summary Display or in one or more Graphical Windows.
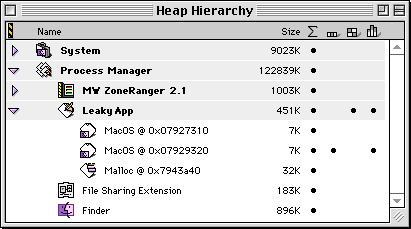
Upon launch, ZoneRanger automatically displays the Heap Hierarchy window that lists all the available processes.
Choose the process whose heap you want to display from the scrolling list. You may select more than one process using standard shift-click or command-click operations. Choose whether to open a 1D Graphical Display, 2D Graphical Display, Summary Display, or Histogram Display-or all four-by activating the bullet markers to the right of the list. To view the heap, double-click the selected process.
As long as a display window remains open, you never have to open that heap again, even if you quit the process and relaunch it. Zone-Ranger reconnects the heap automatically when you relaunch the process.
Zone-Ranger also remembers each heap's bullet settings. When you relaunch a process, Zone-Ranger will restore that process's bullets and hierarchy view to the same way you left them.
"Choosing How Often to Refresh Contents" and "Quitting and Relaunching an Application."
To get more information on a block, click on it and look at the Zone Information popup menu or the Block Information popup menu located in the bottom left corner of the 1D Graphical Display and 2D Graphical Display.
To view the contents of a block, double-click it. Zone-Ranger opens a Block Window, described in "Block Window."
To save the contents of a Graphical window to a text file or a PICT file, choose Save As Text or Save As Picture from the File menu.
"Viewing Information on a Heap Zone and Block."
In the Graphical Windows, you can highlight one of the three types of relocatable blocks with these commands from the Configure menu: Show Locked Handles, Show Purgeable Handles, and Show Resource Handles.
An individual block may be of more than one type-for example, a locked resource. You can highlight one or more type of handle at a time. Use the Legend Information popup menu to customize the color for each combination. See "Changing the Graphical windows' colors" for more information.
The default colors and patterns for the different types of handles are listed in Table 4.1.
Default Handle Colors and Patterns:
| Handle Type |
Color |
Pattern |
|---|---|---|
 TIP
TIP Displaying different kinds of handles allows you to see if you are using memory efficiently. For example, some resources can be very large-PICT resources, sound resources, and so forth. Ideally, these resources should be purgeable so that the Memory Manager can remove them when they are not in use.
By displaying different kinds of handles you can easily see if you have large resource handles that are not purgeable, and discover if you are using memory efficiently.
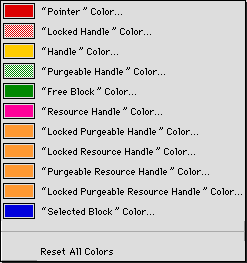
To change the colors used in the Graphical Windows, click the Legend Information menu in the bottom left corner of the window. You will see the current Legend, illustrated in Figure 4.2.
The Legend Information menu contains seven items that correspond to the colors or patterns used to distinguish the various types of blocks that can be displayed in a heap zone.
If you are using a color display, choose an item to change its
color. Zone-Ranger displays the Color Picker. You can then choose
a different color for that type of block. That color is then used
in all Graphical Windows. To restore the colors to their original values, choose Reset All Colors.
TIP You can set the color display of the Graphical Windows independently. For example, you could have the 1D Graphical Display use monochrome and the 2D Graphical Display use color.
 NOTE
NOTE If you're displaying a heap in monochrome, you cannot change the patterns used in a Graphical window.
To get more information on the heap zone in the frontmost window and the selected block, click on the Zone Information or Block Information popup menus. Both of these menus have a "basic" and an "advanced" mode.
The Zone Information popup menu contains information about the current heap zone. This menu can be found on the following windows: 1D and 2D Graphical windows, Find dialog, Block List window, and Block window.
Zone Information popup menu: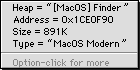
þ
The meaning of each item is explained in Table 4.2.
| Field |
Description |
|---|---|
The Block Information popup menu contains information about the selected block. If there is no block selected, the menu will say No valid block. This menu appears on the Graphical windows and Block window.
The meaning of each item is explained in Table 4.3.
| Field |
Description |
|---|---|
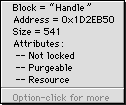
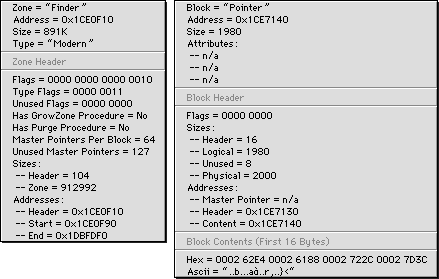
If you hold down the option key while clicking on either menu, you will see some "advanced" information about the current zone or selected block, illustrated in Figure 4.5.
NOTE Advanced information is included in Zone-Ranger for completeness only. The average user will not have need of this information.
When you click on a block in the graphical view, that block is selected and information about the block appears at the bottom of the window. You can then use the arrow keys to select a new block and navigate the heap. The functions of the various keys are analogous to those used in the text editor of the CodeWarrior IDE.
| Key Combination |
Description |
|---|---|
You can use the Page-Up, Page-Down, Home and End keys to scroll the graphical heap view appropriately. Using these keys does not change the current selection.
There are some small differences when using keys to navigate the heap in the 1D Graphical window. These differences are shown in Table 4.5.
1D Graphical window key navigation:
| Key Combination |
Description |
|---|---|
The Histogram Display supports keyboard navigation by using the arrow keys, shown in Table 4.6.
Histogram Display navigation keys:
| Key Combination |
Description |
|---|---|
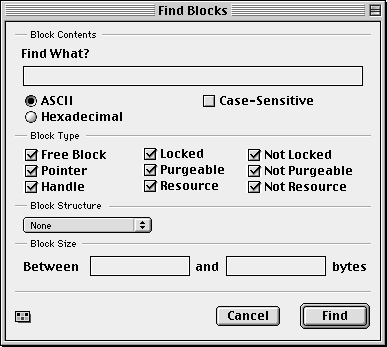
Zone-Ranger can find blocks based on their contents, attributes, structure, or size. Zone-Ranger displays the found blocks in a Block List Window. When you choose Find from the Edit menu, Zone-Ranger displays the dialog illustrated in Figure 4.6.
The Find dialog has four sections, one for each criterion: Block Contents, Block Type, Block Structure, and Block Size. You can set criteria in one, two, or all four sections. Notice the Zone Information popup menu in the lower left corner.
To search for something in the contents of a block, enter the pattern to search for in the Find What? field. Choose ASCII if you've entered the pattern as an ASCII string. Choose Hexadecimal if you entered the pattern as a hexadecimal number. If you entered an ASCII string, turn on the Case-Sensitive option to make sure that the case of the found string exactly matches the case of the string you entered. Turn off the Case-Sensitive checkbox if the case of string doesn't matter. If you entered a Hexadecimal string, the Case-Sensitive option has no effect.
Specify the type of blocks to find in the Block Type section. There are nine checkboxes. With the first three options, you can choose the type of blocks to find: free blocks, pointers, or handles. If you turn off all three block types then Zone-Ranger finds all types of blocks.
If you are looking for handles, you can also choose what type of handles to find: locked handles, purgeable handles, resource handles, handles that are not locked, not purgeable, or not resources. You must have one or both options set for each block type. For example, assume you want to find all locked handles. You must turn off the "Not Locked" option and leave all of the other five handle options on. If you want to find Locked resource handles, turn off "Not Locked" and "Not Resource" and leave the other options on. Then you find all locked resource handles that are either purgeable or not purgeable. If you leave all six options on, you find all handles.
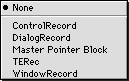
Choose the structure of the block to find. You can choose one of the blocks illustrated in Figure 4.7.
NOTE Blocks in a heap are not marked in any way that would unambiguously indicate the type of structure that is contained in the block. Zone-Ranger must therefore make a heuristic determination of the structure based on the size and contents of the block. Since this determination is heuristic and not absolute, it is reasonable to expect that Zone-Ranger might miss some true matches and include some false matches.
Specify the range of sizes to find in the Block Size section. Enter the minimum and maximum sizes in bytes. If both fields are empty, then Zone-Ranger finds blocks of any size.
TIP You can use Zone-Ranger's Find command to determine if you are using memory efficiently. Search for large, non-purgeable resource handles, for example. Or, when you know your application is in a state where there should not be blocks of a particular type-locked relocatable blocks for example)-search for them to see if you might have forgotten any.
This section describes how to perform several special tasks in Zone-Ranger:
Zone-Ranger lets you choose how often it refreshes the contents of its windows, including the list of running processes in the Heap Hierarchy window. For the heap windows, "refresh the contents" means to reanalyze the heap and display the new results in the window. It does not mean simply drawing the window-the result of a normal window updating process that happens automatically.
Reanalyzing the heap takes time, so you may not want to do it constantly, especially if Zone-Ranger is running in the background. You can set different intervals for refreshing the contents depending on whether Zone-Ranger is the foreground or a background application. Simply choose an interval from the Refresh Foreground or Refresh Background hierarchical menus, as shown in Figure 4.8. Both menus contain any interval from 1 to 5 seconds, Always, and Never.
If you choose Always, Zone-Ranger refreshes the contents of its windows as often as possible.
If you choose Never, Zone-Ranger still refreshes the contents of its windows. However, it only does so when actually drawing the particular window-for example, if you move a foreground window and expose a Zone-Ranger window.
The Refresh Foreground hierarchical menu: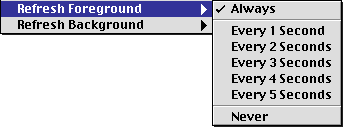
Zone-Ranger lets you compact or purge the heap in the frontmost window. These commands are in the Special menu and are available only when a heap is in the frontmost window.
To purge the heap, choose Purge. To compact the heap, choose Compact. To purge and then compact the heap, choose Compact and Purge. When you issue any of these commands, Zone-Ranger uses the Mac OS Memory Manager to compact and/or purge the heap.
When the Memory Manager purges a heap, it changes unlocked, purgeable handles to free blocks, but does not move any blocks. When the Memory Manager compacts a heap, it moves unlocked handles toward the bottom of the heap until they run into a locked or nonrelocatable block, and merges free blocks together.
TIP These commands can be very useful for discovering fragmentation
problems and for stress-testing your application.
When you compact the heap, all the free and relocatable memory
should occupy a contiguous area in the middle of your heap. If,
after compacting, there are locked or non-relocatable blocks in
the middle of your heap, you've got a fragmentation problem.
If you use purgeable resources without ensuring that they are
in memory, you have a very subtle bug that can be hard to locate.
By forcibly purging your heap you can discover the problem quickly.
To go to a low-level debugger, choose Debugger from the Special menu. You break into the installed low-level debugger. If there is no debugger installed or running, the Debugger command is disabled-you don't have to worry about crashing.
To return to Zone-Ranger, use the appropriate go command for the debugger. If you are using MacsBug, type g and press Return. If you are using The Debugger from Jasik Designs,
select Exit To Program from the Go menu.
Because the Summary Display gives you the total number of each kind of block, it's great for finding memory leaks.
Launch your application, then open a Summary or Graphical window in Zone-Ranger. With either window active, choose Watch For Leaks from the Zone-Ranger Special menu. When you do, the Summary Display is brought to the front, if it was not active, and expands to display additional data as shown in Figure 4.9.
Watching for leaks in the Summary window:
The values, at the moment you choose Watch For Leaks, appear in italic. These don't change-they are the values at the start of the watch. The current numbers appear at the top of the window, in their usual location. These are dynamic and change more or less constantly. The difference between the two appears in bold in the bottom two rows of the Summary Display. This is how the number of blocks has changed since you started the watch.
Look at the number of blocks your process has. Then do things with your application as a normal user would. For example, open and close a window. The point here is to do something, and then return to your initial state. For the Watch For Leaks command to be most useful, you should activate it when your application is idling at a well-defined location-typically the main event loop. Then you should exercise the portion of the code that you want to test. Use that code several times in succession.
When you switch back to Zone-Ranger, look at the last two rows to determine which type of block-if any- is being leaked.
Ideally, you should have the same number of pointers and handles that you had initially. As a result, the difference data should be zero. If the number of these blocks increases, you may have found a memory leak. Pay particular attention to the numbers of pointers and handles. The number of free blocks (and as a result the total number of blocks) can change at any time. A change in the number of free blocks does not mean you have a leak.
If you have a leak, you can open the appropriate list of blocks. Just double-click on a number in the differences row to open the block list. Typically all the blocks in the leak list are the same size, and the number of blocks is directly related to the number of iterations that were taken through the leaky code path.
Note, however, that most applications build and destroy blocks at a prodigious rate. Sometimes, just switching from your application to Zone-Ranger can cause the numbers to change. What you really want to look for is not whether the difference is zero (although its nice when that happens). What you want to look for is a steady increase in the number of pointers or handles after you perform some task and return to your initial state. If that happens, you probably have a memory leak.
Zone-Ranger tracks calls that use the Mac OS Memory Manager-calls
that use NewPtr() or NewHandle() directly or indirectly. If you use any other method to allocate
memory, Zone-Ranger will have a hard time finding leaks.
For example, you may use NewHandle() or NewPtr() to allocate a large block of memory, and then divide that block
into sub-allocations using your own routines. This makes it tougher
for Zone-Ranger to find leaks. All Zone-Ranger knows about is
the large allocation using NewPtr() or NewHandle(). There is no way Zone-Ranger can know what memory looks like
within that handle or pointer.
As another example, the CodeWarrior default implementation of
operator new allocates 64K blocks of memory at runtime. Object allocations
are created out of those blocks without using the Memory Manager.
As a result, the number of blocks do not increase or decrease
predictably as you create or dispose of objects.
In addition, if you allocate an object with new and forget to delete it, you won't be able to find the leak with Zone-Ranger because
there won't be a spare block left hanging around. The leaking
memory is hidden inside the 64K block. You can turn off this default
implementation for new and delete at compile time by setting the NEWMODE compiler flag. Potential values are defined in the "new.cp" file, and are listed here for reference.
Memory allocation modes for operator new:
#ifndef NEWMODE
#define NEWMODE NEWMODE_FAST // default mode
#endif
#define NEWMODE_NONE   0 // do not define new/delete
#define NEWMODE_SIMPLE 1 // call NewPtr/DisposPtr
#define NEWMODE_MALLOC 2 // use malloc/free
#define NEWMODE_NORMAL 3 // regular new/delete
#define NEWMODE_FAST   4 // regular new/delete
												// fast version
The Watch For Tides command is used to help determine the maximum amount of total memory that an application needs to run. You do this by exercising the application and recording the high memory, called high tide, in the Used column of the Summary Display.
Launch your application, then open a Summary or Graphical window in Zone-Ranger. With either window active, choose Watch For Tides from the Special menu. When you do, the Summary Display of the active heap zone is brought to the front, if it was not active, and expands to display additional data as shown in Figure 4.9.
Watching for high and low tide: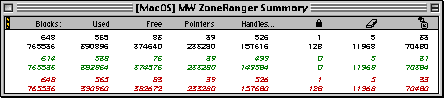
The description of Each row is shown in Table 4.7.
| Row |
Meaning |
|---|---|
Look at the number of blocks your process has. Then do things with your application as a normal user would. For example, open and close a window or file. The point here is to do something, and then return to your initial state. For the Watch For Tides command to be most useful, you should activate it when your application is idling at a well-defined location-typically the main event loop. Then you should exercise the portion of the code for which you are interested in the lowest and highest memory usage.
The data shown in Figure 4.10 indicates (among other things):
Once Watch For Tides has been selected, you can copy the data to the clipboard or save it to a text file.
malloc Heaps A malloc heap is not really a "true" heap, but rather a memory pool technique.
The MSL and runtime libraries utilize this technique to speed
up allocations and minimize "true" heap fragmentation. Browsing
malloc heaps lets you to view the contents of these "mini-heaps."
See the MSL C Reference and the MSL C++ Reference for more information
about malloc heaps.
In a typical scenario, you use Zone-Ranger on a project you are developing. You launch the project, then examine the heap in Zone-Ranger. In the process, you may discover problems.
To correct the problem, you must quit your project. At that point, Zone-Ranger automatically disconnects from your application's heap, because it no longer exists. The Zone-Ranger windows will display an appropriate message. The Graphical Windows tell you that the zone has been destroyed. TheSummary Display shows a series of zeroes in the columns. However, the windows remain open unless you close them manually.
If you leave these windows open and subsequently relaunch the application that was the Zone-Ranger target, the heap information reappears in the windows. Zone-Ranger reconnects to the application automatically. This allows you to find problems, quit the project, correct the problems, and then relaunch the project without having to reopen the heap in Zone-Ranger.