This reference section discusses profiling Mac OS code and associated special cases.
The sections in this chapter are:
You can find all of the profiler libraries and interface files in the Profiler folder in the Metrowerks Utilities folder. The profiling code that actually keeps track of the time spent in a routine exists in a series of libraries. Depending upon the nature of your project and the platform for which you are writing code, you link in one or another of these libraries as appropriate.
See also "Add a profiler library to the project" and "Profiling Special Cases."
The profiler libraries require the Macintosh operating system. You must have the appropriate Mac OS library added to your project as listed in Table 5.1. Your project may need other libraries as well.
| Language |
68K |
PowerPC |
|---|---|---|
Table 5.2 lists the libraries you use for profiling. Both Pascal and C use the same libraries. For 68K code, use the "Small" library for projects using the near code model, and "Large" for the far code and smart code models.
| Library |
Processor |
When To Use |
|---|---|---|
 TIP
TIP Use ProfilerLib, ProfilerMPLib, and ProfilerCarbonLib when you want to collect information across shared library boundaries. If all you want is data from one library, use one of the static link libraries and link it into your project.
For example, say you split your application into an application and 2 shared libraries and want to profile it. You can link a static link library to each part and get three reports, one for each piece. But that data is very hard to interpret because each report is missing some context that happens to be included in another report. By using the shared library version of the profiler, you will get one report that spans all three components.
TIP We have some more tips! When you use a PPC multiprocessor library for profiling, add
to any file that calls MPWaitOnQueue(), MPWaitOnSemaphore() or MPEnterCriticalRegion(). This helps the profiler adjust the timings from the main task.
MP Profiling only works for version 1.4 of the MP software.
The profiler also has separate interface files for C/C++ and Pascal. They are listed in Table 5.3.
The profiler handles recursive and mutually recursive calls transparently. The profiler also warns you when profiling information was lost because of insufficient memory. (The profiler uses memory buffers to store profiling data.)
For leading-edge programmers, the profiler transparently handles
and reliably reports the times for asynchronous completion routines,
multiple threads, 68K code resources, PowerPC shared libraries,
and even abnormally terminated routines exited through the C++
exception handling model (try, throw, catch) or the ANSI C library
setjmp() and longjmp() routines.
C++ programmers may wish to consult the Metrowerks PowerPlant
documentation for information on the StProfileSection class. This class automates the process of initializing the profiler,
dumping results, and exiting the profiler. You do not need to
use the rest of PowerPlant to take advantage of the StProfileSection class.
This section describes the special cases that are specific to profiling Mac OS code:
You can substitute #pragma statements for profiler API function calls to profile your C/C++ code on the function level. However, this is not as useful as the profiler calls. See "Routine-level profiling" for more information.
Setting the "Generate Profiler Calls" Processor preference option
sets a preprocessor variable named __profile__ to 1. If profiling is off, the value is zero. You can use this
value at compile time to test whether profiling is on.
Instead of, or in addition to, setting the option in the Processor preferences, you can turn on profiling at compile time. The C/C++ compiler supports three preprocessor directives that you can use to turn compiling on and off at will.
You can use these directives to turn profiling on for any functions you want to profile, regardless of the settings in the Processor preferences. You can also turn off profiling for any function you don't want to profile.
At the beginning of your code, you call ProfilerInit() to initialize
the Profiler. Table 5.4 shows the prototypes for ProfilerInit() for C/C++.
The parameters tell the profiler how this collection run is going to operate, and how much memory the profiler should allocate for its data buffers. Each parameter and its purpose is given in Table 5.5.
| Parameter |
Purpose |
|---|---|
The collection method may be either collectDetailed or collectSummary. If you collect detailed data, you get information for the calling
tree-the time in each routine and each of its children in the
calling hierarchy. Summary data collects data for the time spent
in each routine without regard to the calling chain. Collecting
detailed data requires more memory.
The timeBase may be-in order of decreasing precision-bestTimeBase, PPCTimeBase, microsecondsTimeBase, timeMgrTimeBase, or ticksTimeBase. The bestTimeBase option automatically selects the most precise timing mechanism
available on the computer running the profiled software. PPCTimeBase is only available with PowerPC chips.
The numFunctions parameter is the approximate number of routines to be profiled.
The stackDepth parameter is the approximate maximum depth of your calling chain.
You don't need to know the precise values ahead of time. If the
profiler runs out of memory to hold data in its buffers, it loses
some data but you'll be told in the results. You can then modify
the parameters in the call to ProfilerInit() to increase the buffers and preserve all your data.
The profiler allocates buffers in temporary memory based on the method of collection, the number of routines, and the depth of the calling tree. Using temporary memory reduces the effect that the profiler has on the application's memory partition.
The call to ProfilerInit() returns a non-zero error value if the call fails for any reason.
Use the return value to ensure that memory was allocated successfully
before continuing with the profiler. Typically you would add this
call as conditionally compiled code so that it compiles and runs
only if profiling is on and the call to Pro-filerInit() was successful.
You call ProfilerInit() before any profiling occurs. Typically you make the call at the
beginning of your code.
"Time and Timebases" and "Memory Usage."
In C/C++, the call would be at the beginning of your main() function.
The call might look like this:
if (!ProfilerInit(collectDetailed, bestTimeBase, 20, 5))
{
// your profiled code
}
Of course, your parameters may vary depending upon how many routines you have and the depth of your calling chains.
"Profiling C++ Static Constructors."
ProfilerInit() in Pascal Call ProfilerInit() at the beginning of your application. In Pascal, it might look
like this:
IF ProfilerInit(collectDetailed,
		bestTimeBase, 20, 5) = noErr THEN
BEGIN
{ your profiled code }
END
Of course, your parameters may vary depending upon how many routines you have and the depth of your calling chains.
The profiler dumps its data to a file when you call ProfilerDump(). The file appears in the current default directory, usually the project directory.
You provide a file name when you call ProfilerDump(). You may dump results as often as you like. You can provide a
different file name for intermediate results (if you have multiple
calls to ProfilerDump()), or use the same name. If the specified file already exists,
a new file is created with an incrementing number appended to
the file name for each new file. This allows the dump to be called
inside a loop with a constant file name. This can be useful for
dumping intermediate results on a long task.
ProfilerDump() does not clear accumulating results. If you want to clear results
you can call ProfilerClear().
A typical call to ProfilerDump() would be placed just before you exit your program, or at the
end of the code you are profiling. The prototypes for ProfilerDump() are listed in Table 5.6.
ProfilerDump() There is only one parameter. It must be a pointer to a Pascal-style string that becomes the file name for your results. A typical call might look like this:
error = ProfilerDump("\pMyCode.prof");
 WARNING!
 Calls to UnloadSeg() in a 68K application cause serious problems for the profiler.
The profiler maintains pointers to locations in the code. If you
unload a segment that has profiled routines, that code is free
to move around in memory, or be purged. At that time the profiler's
internal pointers become invalid. This is the leading cause of
corrupted profile data files.
You may use the profiler to study cooperative threads. The profiler does not support preemptive threads.
To profile a cooperative thread, you do a little setup work when
you create the thread. You call ProfilerCreateThread() to tell the profiler to allocate the necessary buffers. (This
doesn't actually create a thread, just the necessary structures
so the profiler can keep track of a thread.) You provide three
parameters. You specify the number of routines, the byte size
of the stack created for the thread, and provide the address where
the profiler can return a reference to this thread's profile data.
You must keep track of this reference for use in other thread-related
profiler calls.
When your thread gains control and executes, its SwapIn callback
routine is called. In that routine, call ProfilerSwitchToThread() to tell the profiler that this thread is now running. You provide
the profiler's thread reference you got when you called Profiler-CreateThread().
 NOTE
NOTE Do not profile the swapIn routine itself. Thread callback procs (swapIn & swapOut for example) should be compiled to not call the profiler.
When your thread finishes, call ProfilerDeleteThread(). You provide the profiler's thread reference to identify which
thread is involved. This call cleans up the profiler's thread-tracking
structures. You do not need to dump your data before calling Profiler-DeleteThread(). The data collection buffers are separate from the memory used
to track each thread.
You do not need to call ProfilerCreateThread() for the implicit main thread created for your process. However,
if you profile code in some other thread and then want to profile
the main thread, you will need to call ProfilerSwitchToThread() to resume profiling the main thread. You can get the necessary
thread reference by calling ProfilerGetMainThreadRef().
TIP If you are programming in C++, you may want to consider using
the PowerPlant LThread class. This class has built-in support for profiling threads.
See the PowerPlant source code and documentation for more details
on this class.
If you are profiling a multi-threaded application, you should be aware of how the results are shown in MW Profiler.
In summary mode, the profiler will mix all the threads together, and you can't tell what is called from what thread. Object mode does the same as summary mode.
In detailed mode, if the threads have a different top-level procedure (the procedure you register with the Thread Manger), then the profiler will show them as separate top-level entries. Threads with the same top-level name will be combined together. For example, say you have a program whose main() initializes the profiler, starts up 3 threads, and then calls a function to run event loop.
Profiling multi-threaded code:
main()
{
	ProfilerInit(collectDetailed,bestTimeBase,20,5);
	//...Create a DoBackGroundWork thread
	//...Create another DoBackGroudWork thread
	//...Create a thread that runs DoIdleStuff

	DoMainEventLoop();

	ProfilerDump(`test");
	ProfilerTerm();
}
The profile output file for this will have three top-level functions listed in detail mode: DoBackGroundWork, DoIdleStuff, and DoMainEventLoop. The two threads that are running DoBackGroundWork would combine their profile information.
The profiler supports profiling shared libraries for PowerPC and CFM 68K.
Add the shared library named ProfilerLIB to your project instead of the static link library ProfilerPPC.lib. Include the same header (profiler.h).
The shared library profiler collects data from an application and any shared libraries simultaneously. This allows you to split an application into multiple shared libraries and a smaller application, but still profile as if all the components were one large application. Each shared library you create must be compiled with Generate Profiler Information selected in the Code Generation pane in the Project Settings dialog.
NOTE If you are compiling code for the PowerPC, click the Profiler Information checkbox in the Code Generation pane.
The profiler supports profiling code resources.
For 68K code resources, add the Profiler68kA4.lib library to your project instead of Profiler68k.lib. Include the same header (profiler.h).
The code resource must not move in memory between the ProfilerInit() and ProfilerTerm() calls. This is because the A4 globals can move. The profiler
has a pointer to them that is not updated except when you call
ProfilerInit().
For PowerPC code resources, you may use either the static link library ProfilerPPC.lib or the shared library ProfilerLIB. You must make sure that the PowerPC code resource does not move in memory while profiling. This means that profiling accelerated resources under applications that unlock the code resource after each call is not supported.
It is possible to profile static constructor calls if the profiler is initialized before the static constructor is called. If you are working with shared libraries, you need to determine the order in which the shared libraries are loaded. Put the initialize call to the profiler in the first one loaded.
To profile the static constructors called from __sinit(), the profiler must be initialized before calling __sinit().
To do this with the 68K compiler, use the function __PreInit__(void) declared in Listing 5.2.
__myinit: Initializing the 68K compiler in C++:
extern "C" void __PreInit__(void);
void __PreInit__(void)
{
	OSErr error;
	error=ProfilerInit(collectDetailed,
									bestTimeBase, 20, 5);
}
Of course, you'll set the parameters in the call to ProfilerInit() appropriately for your work.
For PowerPC code, write a small routine __myinit that initializes
the profiler, then calls __sinit. Put __myinit in the initialization routine in the Linker preferences pane
in the Project Settings dialog.
__myinit: Initializing the PPC compiler in C++:
OSErr __myinit(InitBlockPtr initBlock)
{
	OSErr error;
	error=ProfilerInit(collectDetailed,
									bestTimeBase, 20, 5);
	if (error == noErr)
		__sinit();
	return error;
}
Before profiling a MacApp-based 68K project, go through the MacApp
source code and comment out all calls to UnloadSeg(). There are only a few.
In a 68K project, calls to UnloadSeg() cause serious problems for the profiler. The profiler maintains
pointers to locations in the code. If you call UnloadSeg() on a segment that has profiled routines, that block of code is
free to move around in memory, or be purged. At that time the
profiler's internal pointers become invalid. This is the leading
cause of "corrupted" profile data files.
The CodeWarrior profiler supports profiling asynchronous completion routines, VBL tasks, Time Manager tasks, deferred tasks, and related code. This is essentially transparent and a by-product of the internal structure and design of the profiler.
However, there are some things to be aware of when working with asynchronous routines and other code that runs at interrupt time.
The small and smart code models for 68K can cause problems for
completion routines. They use A5 relative addressing to call the profiler. Because A5 is not always set up when a completion routine is called, the
embedded call to the profiler will not work. The large code model
uses absolute addressing to call the profiler, which avoids the
problem.
Another way around this problem is to have a small stub routine
that sets up A5 and calls your routine that does the real work. The stub routine
should be compiled without a call to the profiler, and the real
routine can call the profiler.
The profiler correctly reports data for abnormally terminated
functions that exited through the C++ exception handling model
(try, throw, catch) or the ANSI C library setjmp() and longjmp() routines. You do not have to do anything to get this feature,
it is automatic and part of the profiler's design.
However, there is a possibility of some errors in the reported results for an abnormally terminated function.
First, the profiler does not detect the abnormal termination until the next profiling call after the abnormal termination. Therefore, some additional time will be reported as belonging to the terminated function.
Second, if the next profiler event is a profiler entry, and the new stack frame for that function is larger than the frames that were abnormally exited, the profiler will not immediately detect that the original function was abnormally terminated. In that case the profiler will treat the function just entered as a child of the function abnormally terminated. The profiler will correct itself on the next profiling event without this property-that is, when the stack returns to a point smaller than it was when the abnormally terminated function exited.
Finally, remember that the profiler is not closed properly and
the output file is not dumped when ExitToShell() is called. If you need to call ExitToShell() in the middle of your program and want the profiler output, call
ProfilerDump().
If you are using the profiler, you must always call ProfilerTerm() before ExitToShell().
WARNING! If a program exits after calling ProfilerInit() without calling ProfilerTerm(), timers may be left running that could crash the machine.
If you have a PowerPC target, there is one final optimization you can perform to make your code run faster. Sorry, but this optimization does not apply to 68K programming!
The way in which code is organized in memory has a subtle influence on its execution speed. Some functions frequently refer to one another. If we can organize memory so that these functions are placed close together, we can improve the hit rates for the instruction cache. Maximizing the hit rate of the cache makes memory access, and thus our program, faster.
Calling code up from disk is slower than calling it up from RAM. By grouping functions together, the code may live in RAM for a longer time and reduce the amount of time spent on disk access.
Though it is possible that some of your functions may be too large to exist in the cache at the same time, this is less likely these days on systems with an L2 cache of 1MB or more. Figure 5.1 illustrates how your code makes its way from the disk to your CPU.
Movement of code from disk to CPU:
To optimize the way our code is loaded and executed at runtime,
we can ask the profiler to generate a link arrangement (.arr) file. The .arr file groups the functions in our application by their call frequency-functions
that refer to each other often will be clustered together. CodeWarrior
uses the data in the .arr file to generate a faster executable.
The two options available to you are Generate Arrange File which uses a less-sophisticated depth-first traversal algorithm, and Generate Weighted Arrange File which incorporates true call frequency ordering. For general use, you will find that the call frequency ordering of a Weighted Arrange File provides the best function arranging.
To generate and use a Weighted Arrange File, follow these steps:
1. Load the profiler data file into the Profiler.
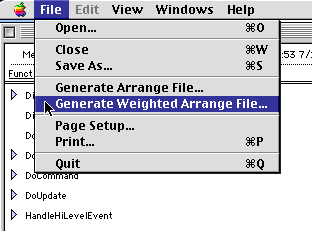
Select File > Generate Weighted Arrange File from the Profiler menu as shown in Figure 5.2. The name you choose for your link arrangement file must end
with the .arr extension. MyApp.arr will do nicely.
The Profiler may spend several minutes generating .arr file for a large application. However, a small application will
only take a few seconds.
3. Return to your project in the CodeWarrior IDE.
4. Add the .arr extension to File Mapping.
CodeWarrior should already be set up with the .arr file mapping for new projects by default. If you converted an
older project without the file mapping, make your project aware
of your .arr file by adding its extension to the File Mappings panel. In Target Settings > File Mappings, create a new mapping for the .arr type. As shown in Figure 5.3, you should map the .arr extension as a TEXT file, with no active flags or compiler settings.
File Mappings for the .arr extension.: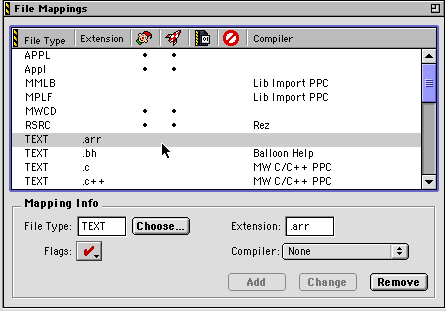
5. Add the .arr file to your project.
Drag MyApp.arr into your project window as shown in Figure 5.4.
Adding the .arr file to your project.: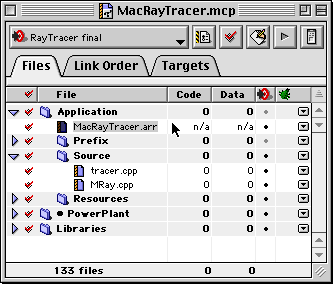
6. Activate the .arr file in the PPC PEF panel.
Go to the Target Settings > PPC PEF panel and click the Code Sorting check box. Choose Use ".arr" file from the menu choices available, then save your settings.
Configuring the PPC PEF to use the .arr file.: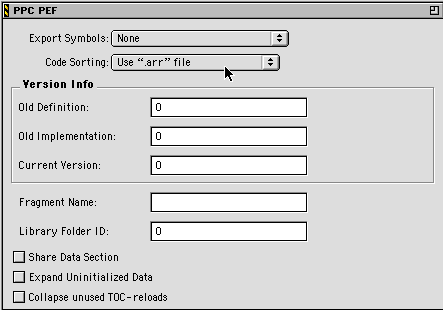
The application that CodeWarrior builds will be optimized to provide
you with the fastest memory accesses possible. If you add new
functions or function calls to your application in the future,
you need to generate a new .arr file.
Do not be alarmed if an error message such as the following appears:
Link Warning : sort file 'MyAppName.arr' did not list all code
		symbols
This warning is normal and should be expected. When the profiler
generates the .arr file, it only includes functions and symbols that are profiled.
For instance, MSL library calls will not appear in the .arr file because the MSL is compiled with profile information off.
The warning message appears to notify you of this.
You may disable these warnings by checking the Suppress Warning Messages checkbox in the PPC Linker panel.
TIP When using the profiler to optimize your code, we recommend that you create separate targets; include your profiler libraries in one, but not the other. You can then use the profiler target to generate the .arr file, and then drop the .arr file into your streamlined release target.
It is possible to debug code that has calls to the profiler in it. However, the profiler does interfere with stepping through code. You may find it simpler to debug non-profiled code, and profile separately. In this section, We'll take you through what happens when you step into a profiled routine and step out of a profiled routine. In addition, we'll talk about the effect that stopping in the debugger has on the profile results.
See also the CodeWarrior IDE User Guide for more information on how to use the debugger.
If you step into a profiled routine you'll see assembly code instead of source code. The compiler has added calls to __PROFILE_ENTRY at the start of the routine. This is how the profiler knows when to start counting time for the routine.
If you step through the assembly code far enough to get to the code derived from the original source code, then switch the view from source to assembly and back again, you can see the original source code.
If you single-step out of a routine being profiled, you end up in the __PROFILE_EXIT assembly code from the profiler library. This is how the profiler knows when to stop counting time for the routine.
If you stop in a profiled routine, the profiler counts all the time you spend in the debugger as time that routine was running. This skews the results.
WARNING! If you debug profiled code, you must be careful not to kill the
code from the debugger. Remember, if you have called ProfilerInit() you must call ProfilerTerm() on exit or you may crash the computer.
For application programming, the CodeWarrior profiler has only
one limitation. You must not call UnloadSeg() in a 68K application.
In a 68K project, calls to UnloadSeg() cause serious problems for the CodeWarrior profiler. The profiler
maintains pointers to locations in the code. If you call UnloadSeg() on a segment that has profiled routines, that block of code is
free to move around in memory, or be purged. At that time the
profiler's internal pointers become invalid. This is the leading
cause of "corrupted" profile data files.
"Profiling Special Cases" for additional considerations in non-application projects.