The PowerPlant Profiler Class is a wrapper class for the Profiler API. It provides an easy to use interface for the initialization and termination functions of the profiler.
If you have used the profiler before to profile C or Pascal code, you are already familiar with how the initialization and termination routines work. In PowerPlant, you never need to call these routines directly. Instead, these calls are handled for you by the constructor and destructor of the profiling class.
In this chapter, you'll learn:
There is a code exercise provided at the end of this chapter to give you a full working tutorial on how to use the profiler class in your PowerPlant programs.
Before you delve into the depths of the Profiler Class, you should familiarize yourself with the profiler in general. We recommend that you read the Profiler Guide first to become familiar with all aspects of the profiler. Some information is reiterated here, but you should read the Profiler Guide for more in-depth information.
You use a profiler to measure the runtime performance of your code. What is usually important is how your code's performance measures up to some standard. When approaching the problem of measuring performance, you might want to take these three steps.
For example, you might decide that you want the program to load in less than ten seconds, or check the spelling of a five-page document that contains no misspellings in 15 seconds. Decide the platform you will use for testing as well: a Power Macintosh is a bit faster than a Mac Plus.
2. Determine how to measure time.
Your measurement device may be no more complicated than a stopwatch, or you may need to add some simple code to count ticks. At this phase you want to test the code in as close to its finished form as possible, so measure time in a way that is accurate enough to suit your needs, and that has the lowest impact on your code's natural performance. You do not want to run a full-blown profile here, because profiling can add significant overhead, thus slowing down your code's raw performance.
3. Run the tests and measure results.
If you meet your performance goals, your job is done. If your code does not meet your goals, then it's time to profile your code.
To make sure you get a good profile of your code, there are few general rules of thumb you need to follow.
Optimization settings will cause skewed results in the profiler output. Part of the reason for profiling your code is so you can optimize it yourself as much as possible. Once you are confident you've done all you can, you can turn on optimizations in the final build of your application.
2. Turn off virtual memory or RAM Doubler
Profiling code with virtual memory or RAM Doubler active produces erratic and skewed result times. If your program runs quickly without virtual memory or RAM Doubler active, it will run quickly with them active.
Speed Doubler is a performance enhancement series of extensions. As such, it will skew your result times and should therefore be disabled while profiling your code.
 TIP
TIP It's actually best to turn off all extensions when doing a profile of your code. This will eliminate any chances of extension problems and background tasks skewing the profile results. Restart your computer with the Shift key held down to disable extensions.
4. Do not use UnloadSeg() in 68K code
Calls to UnloadSeg() will cause garbage output when you look at your data with the
MW Profiler application. Comment out, or remove calls to UnloadSeg() until the final build of your program.
The PowerPlant profiler class is called StProfileSection and is found in UProfiler.cp. The "St" means that this is a stack-based class and functions
accordingly. This class is an independent class and can therefore
be used with or without the rest of PowerPlant.
StProfileSection makes two assumptions when calling Profiler-Init(). First, it uses collectDetailed as the data collection method. Second, it uses bestTimeBase for the timing method parameter. StProfileSection only has two member functions, a constructor and a destructor.
See Also "Profiler Function Reference" for more information on the parameters used for ProfilerInit().
The class constructor takes three parameters and performs two
main operations. It initializes three data members with the values
you provide, and calls ProfilerInit() using these values. The constructor is declared as follows:
StProfileSection( Str255 inDumpFileName,

		SInt16 inNumFunctions,

		SInt16 inStackDepth);
TIP If you are profiling your entire PowerPlant program, you should
use large values for inNumFunctions and inStackDepth. The values you use will depend on the size of your program.
For example, use 2500 for inNumFunctions and 100 for inStackDepth to start, then increase either of these values if necessary after
each profile run. Also, remember it may become necessary to increase
the memory size of your application program as profiling takes
more memory than would normally be required.
The three data members are shown in Table 6.1.
StProfileSection data members:
| Data Member |
Stores |
|---|---|
~StProfileSection() is the class destructor. It is called automatically as soon as
the code you are profiling goes out of scope. If you are profiling
one area of your code, it's when that function ends. If you are
profiling your entire application, it's when the application quits.
The destructor does all the house cleaning work. It calls ProfilerSetStatus() to stop profiling while it performs the clean up, calls ProfilerGetDataSizes() to test memory requirements and sends an Assert_() if there wasn't enough memory, calls ProfilerDump() to dump the results to the file, and finally, calls ProfilerTerm() to end the profile session.
 NOTE
NOTE If you get an Assert_() message, it means the values you provided for inNumFunctions and inStackDepth are too low. You will need to re-profile your code using larger
values.
To profile your code, you do four things.
1. Set up your project for profiling
This step is very similar to the description given in the Profiler Guide. The only changes are the source file you add to your project, and the header file you add to your code. More detail on this is given in the code exercise.
2. Run a profiler on the area of the code you want tested.
This might be a single routine, a group of routines that perform a task, or even the entire application. What you profile depends upon what you are testing.
Declare a local StProfileSection variable, and provide the proper setup information. Your declaration
will look something like this:
StProfileSection theProfile("\pTest", 50, 50);
All code that runs from that point on, until theProfile goes out of scope, will be profiled.
3. Analyze the data collected by the profiler and improve your code.
You study the results of your profiling and look for problems and room for improvement. For details on how to review the results, see "Viewing Results."
The profiling process is iterative. You repeat steps 2 and 3 until you achieve the performance gain you need to meet your goals.
4. Run your code without the profiler
When you are satisfied that you have reached your goals, you have one more step to perform. You should run your original tests-without the profiler of course-to verify that your code in its natural state meets your performance goals.
Implementing the above steps in your program is simple and only requires two lines of code.
This code exercise uses the Documents solution code from the File
I/O chapter of The PowerPlant Book. The code can be found on the
CodeWarrior Reference CD, in the CodeWarrior Examples: MacOS Examples:PP Book Code:Chap 13 Solution
Code folder.
 WARNING!
 It is important for this exercise that you use the Solution code for the Documents application. Using the Starter Code will either not compile, or crash when run, unless you have finished it in the exercise in The PowerPlant Book.
In this exercise you will perform two different profiles. The first profile will only focus on one routine (and any routines it calls). The second profile will be the entire application. The steps for each are similar.
There is one important thing to remember when you want to profile
a single routine. You are also profiling all other routines called
directly or indirectly by the routine being profiled. This is
important in order to provide the correct parameters to the constructor.
This part of the code exercise will profile the OpenFile() routine in CTextDocument.cp.
WARNING! When you are profiling a single routine, you must declare your StProfileSection variable in the function that calls the routine you want to profile. If you declare an StProfileSection variable inside the function you want to profile, you will not see the name of
your routine in the MW Profiler application. Your routine would
still be profiled, but you would be missing an important point
of reference in the resulting data.
1. Set up the project for profiling
There are two things you need to do for this step. You can do these in any order you wish. First, add the necessary source and library files to your project. Then turn on profiling from the preference panel. These steps are the same for both 68K and PowerPC projects.
a. Adding files to the project
Add UProfiler.cp to your project as well as the appropriate library. The library
you add depends on the type of program you are writing and your
target platform (68K or PowerPC). Table 6.2 lists the libraries and shows you when to use them.
| Library |
Processor |
When To Use |
|---|---|---|
The example shown in Figure 6.1 uses ProfilerPPC.lib for this exercise.
See Also "Profiler Libraries and Interface Files" for more information on profiler libraries.
Adding profiler files to the project: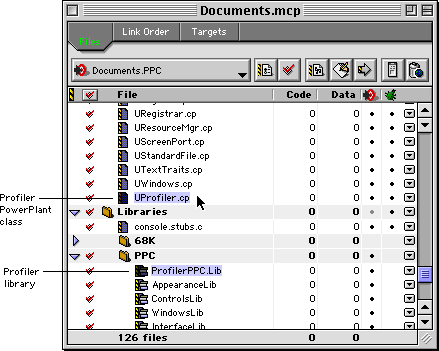
b. Turn on profiling for the project
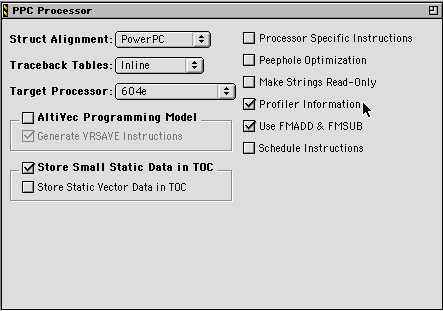
Select Profiler Information from the PPC Processor preference panel as shown in Figure 6.2Figure 6.2.
You need to include UProfiler.h in the file that makes the call to the StProfileSection class. It is not needed in any other file in your project even
if the routine your profiling calls routines in a different file.
#include <UProfiler.h>
3. Declare an StProfileSection variable
CTextDocument() CTextDocument.cp
In order to profile the routine you want, you declare the StProfileSection variable in the routine that makes the call to the function you
are concerned with. In this case, you put the declaration in the
class constructor right before the call to OpenFile().
// Set name of window or open file. if ( inFileSpec == nil ) {
NameNewDoc();
} else {
// Profile the OpenFile routine
StProfileSection theProfile("\pTest", 50, 50);
OpenFile( *inFileSpec );
4. Build and run the application
That's all there is to it! Once the application builds successfully, run the application, open a file, then quit. There will be a file called "Test" in the same folder as the application. You can then use the MW Profiler application to view the results.
See Also "Viewing Results" for more information on how to view your data.
You might decide you want to get the "big picture" of what's happening in your code. To do that, you would profile your entire PowerPlant program.
The steps you perform are exactly the same as shown above with
the exception of steps two and three. If you've performed the
above tasks, remove the header file and the declaration of StProfileSection and replace them with the following steps.
Add the header file to the top of CDocumentsApp.cp.
#include<UProfiler.h>
2. Declare the StProfileSection variable
You do not necessarily need to profile the initialization code
unless you feel it is a concern. The code below declares the class
before the Run() command is given. You may put it at the top of main() if you wish.
// Create the application object and run it. CDocumentsApp theApp;
StProfileSection theProfile("\pApp", 2500, 100);
3. Build and run the application
That's all there is to it! Once the application builds successfully
and runs, a complete profile of the application will be built.
You have to quit the application for the StProfileSection class to go out of scope, write the data, and close the file.
Once you've done that, there will be a file called "App" in the
same folder as the application. You can then use the MW Profiler
application to view the results.
TIP If you run multiple profiles of your code, the profiler routines are smart enough not to overwrite the same dump file. Instead, it will append a number after the file name (e.g.: App2). This is useful if you want to compare different profiles of your program (as you make changes) and not have to change your code. For example, you may want to compare the 68K version with the PowerPC version. For reliable comparisons, make sure you profile exactly the same routines each time, and in each version.
See Also "Viewing Results" for more information on how to view your data.