NOTE
NOTE
The CodeWarrior debugger lets you debug Java code as easily as C/C++ or Pascal code. This chapter assumes you are already familiar with the CodeWarrior debugger. If you need more information about the debugger, see the IDE User Guide.
If you want a quick tutorial showing you how to use the debugger with Java, see "Java Programming Tutorial."
If you want step-by-step information on running a Java project under the debugger, see "Debugging a Java Project."
This chapter contains the following sections:
NOTE To debug Java source on Windows, you must install the Sun Java Development Kit (JDK). The Sun JDK installer is included on your CodeWarrior CD.

The CodeWarrior Debugger contains many features that are specifically for debugging Java projects. It lets you:
The debugger has a few limitations:
Multi-language stepping is not supported. When debugging a Java
program with native C methods in it, the debugger treats it as
a Java program and it will not be able to step into any native
code. On the Macintosh, multi-language stepping is not fully supported.
If you implement some native methods in C, you can open both the
Java class files and the C SYM files for the native methods in
the debugger at the same time. And if you set breakpoints in both
the C and Java files, the debugger will automatically break at
those statements. However, the stack crawl window does not show
the call chain across languages and you cannot single step from
C code to Java code or from Java code to C code. The debugger cannot debug compressed Jar or compressed zip files.
This includes Java applications that are in compressed Jar or
compressed zip format. Debugging of Java code that is executed from within a native application
(via JNI) is possible with CodeWarrior but not straightforward.
For instructions on how to do this, see "Debugging Java Code in Native Applications (Windows Only)". The CodeWarrior debugger does not automatically load symbolics
information for class files and Jar files other than the ones
your project and its subprojects generate. If you want to step
into a library that your Java application uses but is not built
by your project, you must open the jar file in the IDE (in addition
to having your application project open in the IDE).
CodeWarrior Java tools support remote debugging using the Sun
Java VM. This means that you can run a Java executable on one
machine (the remote machine), and use CodeWarrior to debug it from a separate machine (the
local machine).
In order to debug a remote Java application, you must have a CodeWarrior project open in the CodeWarrior IDE on the local machine. The project you are using on the local machine must correspond to the Java application that is running on the remote machine.
The steps you must take to debug a remote Java application are different depending on which platform the remote application is running, and which debugger wire protocol you want to use. Table 7.1 shows the debugger wire protocols supported by each JDK version.
JDK Version
Debugger Wire Protocol Supported
Debugger Wire Protocols Supported:
This section steps you through setting up the CodeWarrior IDE and your Java project for debugging a Java application on each of the following platforms:
This section steps you through how to set up and initiate a debug session using the CodeWarrior IDE to debug a remote Java application running on Windows.
The first thing to do is to generate the Java application on the local machine.
Before building the project, ensure that the source code files you want to debug have a mark next to them in the debug column of the project window. Also ensure that debugging is enabled.
 TIP
TIP When debugging is enabled, the Project > Run menu item changes to Project > Debug, and the Project > Enable Debugger menu item changes to Project > Disable Debugger.
Build the debug target on the local machine by choosing Project > Make from the CodeWarrior menu bar, or by clicking the Make button on the project window.
Build the Java application just as you would if you were going to debug it locally. Do not change any target settings. The output type of the executable can be a Jar file, class folder, or application. See "Java Output" for information on how to specify the output type.
The application you wish to debug needs to be moved to the remote machine so that you can run it there.
Copy the Jar file or class folder to the remote machine.
NOTE If the Output Type is Class Folder, be sure to include the entire hierarchy of files
needed to run the Java application on the remote machine.
Now we will configure the CodeWarrior debugger on the local machine.
1. Open the IDE Preferences... window.
Choose Edit > Preferences... from the CodeWarrior IDE menu bar. The IDE Preferences window is displayed.
2. View the Java Debugging settings panel.
Click on Java Debugging in the IDE Preference Panels list located on the left side of the IDE Preferences window. The Java Debugging preferences panel is displayed.
Click the Remote Debugging checkbox to select it. This enables remote debugging.
4. Supply the Remote TCP/IP Address.
In the Remote IP Address edit field, supply the IP address of the machine on which the Java executable you wish to debug resides.
In the Port ID edit field, supply the port number that is to be used for communication between the CodeWarrior debugger and the Java VM on the remote machine. This number must correspond with the port number being used by the Java VM on the remote machine.
NOTE If the local machine is running classic Mac OS, skip steps 6 and 7. The Mac
OS-hosted Java debugger does not support JDWP and therefore always
uses the 1.1.x Wire Protocol.
6. Choose the debugger wire protocol.
Select the debugging protocol you want to use from the Protocol pop-up menu. You can choose between the 1.1.x Wire Protocol and the Java Debugger Wire Protocol.
If you choose Java Debugger Wire Protocol, skip step 7.
If you are using the 1.1.x Wire Protocol, you need to tell the CodeWarrior debugger which JDK version
the remote machine is using. In the Runtime Settings panel, select the JDK version you want to use from the JDK Version pop-up menu. This choice should reflect the JDK version of the
remote Java VM.
The CodeWarrior debugger is now configured for remote debugging.
It is necessary to specify the TCP/IP port used for communications between the CodeWarrior debugger and the Java VM when running the application on the remote machine in order for the CodeWarrior debugger to connect to the Java VM and your application.
On Windows, this information is specified in the command you issue to the Java VM to launch the executable. The wording for this command line option is different for each JDK version:
-debugport 8000
-Xdebugport 8000
-Xrunjdwp:transport=dt_socket,server=y,address=8000,suspend=y
-Xrunjdwp:transport=dt_socket,server=y,address=8000,suspend=y
Full command line examples are provided in the section "Launch the Remote Java VM".
In order to debug the Java executable remotely with the CodeWarrior
debugger, you must disable the JITC (Just In Time Compiler) in the Java VM on the remote machine.
The JIT compiler can be disabled on Windows by supplying the command-line option shown in Listing 7.5 when launching the Java VM.
-Djava.compiler=NONE
Full command line examples are provided in the section "Launch the Remote Java VM".
NOTE It is not necessary to specify the JIT disabling switch if you are using the Hotspot VM in JDK 1.3. However, if you are running the classic VM you will need to disable JIT. You can run the classic VM in JDK 1.3 by specifying "-classic" as the first argument in the comand line
Now we will run the Java executable on the remote machine. Debugging must be enabled in the remote Java VM. This section contains instructions on how to run the Java VM with remote debugging enabled.
To launch the Windows Java VM with debugging enabled, you must execute a command in the Windows Command Prompt window.
1. Open the Command Prompt window.
Open the Command Prompt window and prepare to issue a command.
2. Issue the command to launch the Java VM.
Now we will launch the Java VM by issuing a command. The command you issue must correspond to the version of Java you have installed. Following are some example commands for a project with an Output Type of Jar file:
c:\jdk1.1.8\bin\java_g.exe -debug -debugport 8000 -Djava.compiler=NONE -classpath "c:\jdk1.1.8\lib\classes.zip;c:\MyApp\AppClasses.jar" sun.tools.debug.EmptyApp
c:\jdk1.2\bin\java.exe -Xdebug -Xdebugport 8000 -Djava.compiler=NONE "-Xbootclasspath:c:\jdk1.2\jre\lib\rt.jar;c:\jdk1.2\lib\tools.jar" -cp "c:\MyApp\AppClasses.jar;" sun.tools.agent.EmptyApp
c:\jdk1.2.2\bin\java.exe -Xdebug -Djava.compiler=NONE -Xnoagent -Xrunjdwp:transport=dt_socket,server=y,address=8000,suspend=y -cp "c:\MyApp\AppClasses.jar" <MainClassName>
c:\jdk1.3\bin\java.exe -classic -Xdebug -Djava.compiler=NONE -Xnoagent -Xrunjdwp:transport=dt_socket,server=y,address=8000,suspend=y -cp "c:\MyApp\AppClasses.jar" <MainClassName>
c:\jdk1.3\bin\java.exe -Xdebug -Xnoagent -Xrunjdwp:transport=dt_socket,server=y,address=8000,suspend=y -cp "c:\MyApp\AppClasses.jar" <MainClassName>
Choose Project > Debug from the CodeWarrior menu bar on the local machine to start the debugger.
This section steps you through how to set up and initiate a debug session using the CodeWarrior IDE to debug a remote Java application running on Mac OS.
Ensure that the file named MWDebugger.jar is installed on the remote system in the System Folder:Extensions:MRJ Libraries:MRJ Classes: folder. This file is normally installed by the CodeWarrior installer
in the same location on the local system.
NOTE Since it is preferred that developers use MRJAppBuilder to build Mac OS Java applications, these instructions assume you are building and debugging a MRJAppBuilder application. If you are using an older method, the steps may differ slightly.
The first thing we must do is generate the Java executable.
Make sure that the project files you want to debug have a mark next to them in the debug column of the project window.
Build the debug target on the local machine by choosing Project > Make from the CodeWarrior menu bar, or by clicking the Make button on the project window.
If the remote machine is running Mac OS, the executable should be a stand-alone Java application so that the CodeWarrior debugger can connect to the executable. For information on how to build an stand-lone application with the CodeWarrior IDE and MRJAppBuilder, see "Stand-alone Applications for Mac OS".
It is necessary to specify the main class and debugger port to the Java VM when running the application on the remote machine in order for the CodeWarrior debugger to connect to the Java VM and your application.
On Mac OS, this information is stored in the .properties file by the IDE when the application is built. We will edit this
file now.
We advise you to copy the .properties file to the remote system before editing it so that the original
.properties file remains intact.
NOTE Rather than editing the .properties file yourself, you may elect to change the corresponding settings
in the IDE Target Settings window. Note, however, that if you change IDE settings, the IDE
will transfer them to the .properties file the next time the project is built. You will have to change
the settings back for the application to run correctly with the
debugger disabled.
1. Open the .properties file in CodeWarrior.
Open the OutputFilename.properties file by choosing File > Open from the CodeWarrior menu bar (where OutputFilename is the output
file name specified in the Java MRJAppBuilder target settings panel). The .properties file is located in the same folder as your project file.
2. Specify the CodeWarrior debugger as the main class.
Under the comment "#IDE created properties" is a property called "com.apple.mrj.application.main." Change the property value to "com.mw.debug.MWDebugger."
NOTE This property normally contains the name of the main class, as
specified in the Main Class edit field of the Java Target settings panel. The CodeWarrior IDE transfers the contents of
the Main Class edit field into the .properties file when the target is built.
It is necessary to specify the TCP/IP port used for communications between the CodeWarrior debugger and the Java VM when running the application on the remote machine in order for the CodeWarrior debugger to connect to the Java VM and your application.
Under the comment "#IDE generated properties" is a property called "com.apple.mrj.application.parameters." Add to the property value "-debugport 8000."
NOTE This property normally contains program arguments specified in
the Program Arguments edit field of the Runtime Settings settings panel. The CodeWarrior IDE transfers the contents of
the Program Arguments edit field into the .properties file when the target is built.
In order to debug the Java executable remotely with the CodeWarrior
debugger, you must disable the JITC (Just In Time Compiler) in the Java VM on the remote machine.
If you are using a version of JBindery prior to 2.2, you must
add a resource to the executable in order to disable the JIT compiler.
Add a resource named "¬jit" (0xC26A6974) with an ID of 128 containing a single byte of data that is 1
(0x01). When this resource is present, the Java VM will not use the
JIT compiler.
If you are using JBindery 2.2, disabling the JIT compiler is much easier. There is a setting in the JBindery application's settings window that allows you to disable the JIT compiler. Open the JBindery settings window, and view the Advanced section. Then uncheck the Disable the JITC box.
If you are using MRJAppBuilder, open the .properties file generated by the CodeWarrior IDE, and add this a property
called "com.apple.mrj.application.jitc.disable" under the comment "#User entered properties." Make the value of the property equal to "true." The property should appear similar to Listing 7.11.
Disabling JIT in a MRJAppBuilder application:
#User entered properties:com.apple.mrj.application.jitc.disable = true
See the documentation that came with your JDK for more information on the JIT compiler.
The executable you wish to debug needs to be moved to the remote machine so that you can run it there.
If the remote machine is running Mac OS, copy the executable,
.properties file (if any), Jar file, or class folder (if any) to the remote
machine.
NOTE If the Output Type is Class Folder, be sure to include the entire hierarchy of files needed to run
the Java executable on the remote machine.
Now we will configure the CodeWarrior debugger on the local machine.
1. Open the IDE Preferences... window.
Choose Edit > Preferences... from the CodeWarrior IDE menu bar. The IDE Preferences window is displayed.
2. View the Java Debugging settings panel.
Click on Java Debugging in the IDE Preference Panels list located on the left side of the IDE Preferences window. The Java Debugging preferences panel is displayed.
Click the Remote Debugging checkbox to select it. This enables remote debugging.
4. Supply the Remote TCP/IP Address.
In the Remote IP Address edit field, supply the IP address of the machine on which the Java executable you wish to debug resides.
In the Port ID edit field, supply the port number that is to be used for communication between the CodeWarrior debugger and the Java VM on the remote machine. This number must correspond with the port number being used by the Java VM on the remote machine.
NOTE If the local machine is running classic Mac OS, skip steps 6 and 7. The Mac
OS-hosted Java debugger does not support JDWP and therefore always
uses the 1.1.x Wire Protocol.
6. Choose the debugger wire protocol.
Select the debugging protocol you want to use from the Protocol pop-up menu. You can choose between the 1.1.x Wire Protocol and the Java Debugger Wire Protocol.
If you choose Java Debugger Wire Protocol, skip step 7.
If you are using the 1.1.x Wire Protocol, you need to tell the CodeWarrior debugger which JDK version
the remote machine is using. In the Runtime Settings panel, select the JDK version you want to use from the JDK Version pop-up menu. This choice should reflect the JDK version of the
remote Java VM.
The CodeWarrior debugger is now configured for remote debugging.
Now we will run the Java executable on the remote machine. Debugging must be enabled in the remote Java VM.
To launch the Mac OS Java VM with remote debugging enabled, you simply run the executable. You can do this by double-clicking the application in the Finder.
Choose Project > Debug from the CodeWarrior menu bar on the local machine to start the debugger.
This section steps you through how to set up and initiate a debug session using the CodeWarrior IDE to debug a remote Java application running on Solaris.
The first thing to do is to generate the Java application on the local machine.
Before building the project, ensure that the source code files you want to debug have a mark next to them in the debug column of the project window. Also ensure that debugging is enabled.
TIP When debugging is enabled, the Project > Run menu item changes to Project > Debug, and the Project > Enable Debugger menu item changes to Project > Disable Debugger.
Build the debug target on the local machine by choosing Project > Make from the CodeWarrior menu bar, or by clicking the Make button on the project window.
Build the Java application just as you would if you were going to debug it locally. Do not change any target settings. The output type of the executable can be a Jar file, class folder, or application. See "Java Output" for information on how to specify the output type.
The application you wish to debug needs to be moved to the remote machine so that you can run it there.
Copy the Jar file or class folder to the remote machine.
NOTE If the Output Type is Class Folder, be sure to include the entire hierarchy of files
needed to run the Java application on the remote machine.
Now we will configure the CodeWarrior debugger on the local machine.
1. Open the IDE Preferences... window.
Choose Edit > Preferences... from the CodeWarrior IDE menu bar. The IDE Preferences window is displayed.
2. View the Java Debugging settings panel.
Click on Java Debugging in the IDE Preference Panels list located on the left side of the IDE Preferences window. The Java Debugging preferences panel is displayed.
Click the Remote Debugging checkbox to select it. This enables remote debugging.
4. Supply the Remote TCP/IP Address.
In the Remote IP Address edit field, supply the IP address of the machine on which the Java executable you wish to debug resides.
In the Port ID edit field, supply the port number that is to be used for communication between the CodeWarrior debugger and the Java VM on the remote machine. This number must correspond with the port number being used by the Java VM on the remote machine.
NOTE If the local machine is running classic Mac OS, skip steps 6 and 7. The Mac
OS-hosted Java debugger does not support JDWP and therefore always
uses the 1.1.x Wire Protocol.
6. Choose the debugger wire protocol.
Select the debugging protocol you want to use from the Protocol pop-up menu. You can choose between the 1.1.x Wire Protocol and the Java Debugger Wire Protocol.
If you choose Java Debugger Wire Protocol, skip the next step. 7
If you are using the 1.1.x Wire Protocol, you need to tell the CodeWarrior debugger which JDK version
the remote machine is using. In the Runtime Settings panel, select the JDK version you want to use from the JDK Version pop-up menu. This choice should reflect the JDK version of the
remote Java VM.
The CodeWarrior debugger is now configured for remote debugging.
It is necessary to specify the TCP/IP port used for communications between the CodeWarrior debugger and the Java VM when running the application on the remote machine in order for the CodeWarrior debugger to connect to the Java VM and your application.
On Solaris, this information is specified in the command you issue to the Java VM to launch the executable. The wording for this command line option is different for each JDK version:
-debugport 8000
-Xdebugport 8000
-Xrunjdwp:transport=dt_socket,server=y,address=8000,suspend=y
-Xrunjdwp:transport=dt_socket,server=y,address=8000,suspend=y
Full command line examples are provided in the section "Launch the Remote Java VM".
In order to debug the Java executable remotely with the CodeWarrior
debugger, you must disable the JITC (Just In Time Compiler) in the Java VM on the remote machine.
The JIT compiler can be disabled on Solaris by supplying the command-line option shown in Listing 7.16 when launching the Java VM.
-Djava.compiler=NONE
Full command line examples are provided in the section "Launch the Remote Java VM".
NOTE It is not necessary to specify the JIT disabling switch if you are using the Hotspot VM in JDK 1.3. However, if you are running the classic VM you will need to disable JIT. You can run the classic VM in JDK 1.3 by specifying "-classic" as the first argument in the comand line
Now we will run the Java executable on the remote machine. Debugging must be enabled in the remote Java VM. This section contains instructions on how to run the Java VM with remote debugging enabled.
To launch the Solaris Java VM with debugging enabled, you must execute a command in a terminal window.
Open a terminal window and prepare to issue a command.
2. Issue the command to launch the Java VM.
Now we will launch the Java VM by issuing a command. The command you issue must correspond to the version of Java you have installed. Following are some example commands for a project with an Output Type of Jar file:
java_g -debug -debugport 8000 -Djava.compiler=NONE -classpath "/usr/local/jdk1.1.8/lib/classes.zip:~/MyApp/AppClasses.jar" sun.tools.debug.EmptyApp
java -Xdebug -Xdebugport8000 -Djava.compiler=NONE "-Xbootclasspath:/usr/local/jdk1.2/jre/lib/rt.jar:/usr/local/jdk1.2/lib/tools.jar" -cp "~/MyApp/AppClasses.jar" sun.tools.agent.EmptyApp
java -Xdebug -Djava.compiler=NONE -Xbootclasspath: /usr/local/jdk1.2/jre/lib/rt.jar: /usr/local/jdk1.2/lib/tools.jar <MainClassName>
java -Xdebug -Xnoagent -Xrunjdwp:transport=dt_socket,server=y,address=8000,suspend=y -cp "~/MyApp/AppClasses.jar" <MainClassName>
Choose Project > Debug from the CodeWarrior menu bar on the local machine to start the debugger.
The debugger always takes control if an uncaught exception is thrown. An uncaught exception is one which will not be caught by the application and will cause the application to terminate.
Whether or not the debugger will take control when a caught exception is thrown depends on which of the following menu items is active:
Debug > Break on Java exceptions sub-menu:
When you are debugging a Java program, the running process is either the specified applet viewer, or the Java interpreter.
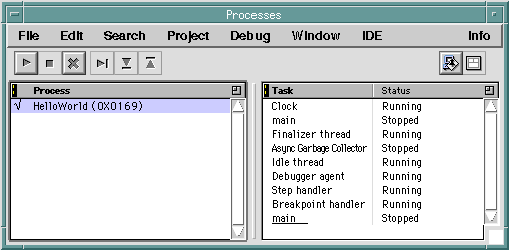
To view Java thread information when debugging your project choose Windows > Proceses Window (Mac OS) or View > Processes (Windows) and look for the process item that represents the debug session you are running. If your project is a Java applet project, look for the process item that contains the name of the HTML file hosting the applet. If your project is a Java application project, look for the entry that contains the main class name of your application. When you select the item, the Java threads will appear in the right pane
To display a debugger Program window for a thread, double-click it. To pause, continue, or kill a thread, select it and use the buttons in the Processes window.
NOTE Many of the threads listed in the processes window are spawned by the applet viewer or interpreter running the Java program, or threads for the CodeWarrior Debugger. Pausing or killing one of them will have unforeseeable (and possibly quite unfortunate) consequences.
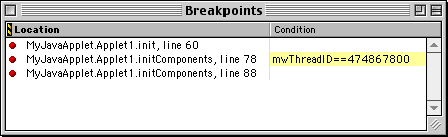
The CodeWarrior IDE allows you to set conditional breakpoints that only halt the debugger for a certain thread. To set such a breakpoint, follow these steps:
1. Set a normal breakpoint in your code.
Click in the breakpoint column next to the line on which you want the debugger to stop. The IDE displays a red dot next to the line.
2. Open the Breakpoints window.
Choose Window > Breakpoints Window to open the Breakpoints window (Figure 7.2).
Enter the following into the Condition column next to the breakpoint you want to conditionalize:
where ThreadID is the numeric ID of the thread. You can obtain the ID of a thread from the Task column of the Processes window.
NOTE Conditional breakpoints are mostly unsupported for Java. Only conditions involving primitive local variables are supported.
You can view a listing of the Java Virtual Machine instructions
that implement the class. Choose Assembler or Mixed from the Source pop-up menu at the bottom of any Browser or Program window (Figure 7.3).
The mixed view shows your Java source first, then the assembly language instructions that make up the Java code immediately after.
When viewing the assembly, you can still set breakpoints, step
through code, and view variables. You can also view the assembly
for a Java file in CodeWarrior by choosing Project > Disassemble.
Viewing Java Virtual Machine Instructions: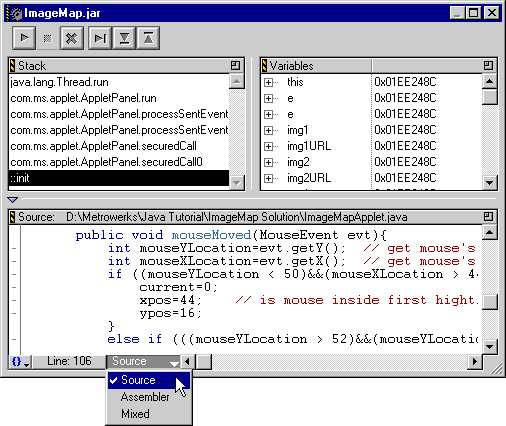
This section discusses how to launch and debug a Java application that runs within a native Windows application.
In the text that follows, we make several references to a folder
named VM Launcher Example on the CodeWarrior CD. It is in the following location.
CodeWarrior Examples/CodeWarrior Java/Metrowerks Sample Projects/
To better understand what is needed to debug a Java session runnin in a native application with CodeWarrior using the Sun Java VM, it is important that you know the following:
Because of these things, attaching to a running VM requires that the following be true:
1. The VM must be launched to be debuggable on a particular TCP/IP port.
2. The debugger must attach to the known TCP/IP port once the VM has been launched.
So, you can see that attaching to a running Java VM is not as seamless as attaching to a native Windows executable.
The first thing you must do is configure CodeWarrior so that it will allow you to attach the Java debugger to a TCP/IP port. You must define one or more ports that CodeWarrior will use for debugging.
The way to define the port(s) is via the registry. The VM Launcher Example folder contains a file named DebugPorts.reg for this purpose. Examine the file in Notepad by right-clicking the file and choosing Edit from the resulting pop-up menu. The file should appear similar
to Listing 7.21. Edit the port numbers to suit your needs. Then save and close
the file.
REGEDIT4[HKEY_LOCAL_MACHINE\SOFTWARE\Metrowerks\CodeWarrior\4.1\Java VMs]"JDWP debug ports"="8000,8001,8002,8003""11XWP debug ports"="8004,8005,8006,8007"
JDK versions 1.1.x, 1.2, and 1.2.x support the 1.1.x Wire Protocol debugging ports. Only JDK version 1.2.2 with JDWP installed or JDK version 1.3 supports JDWP debugging ports. The value data must consist of one or more port numbers, separated by commas. For more information on debugging with JDWP, see the Sun Java Debugger plugin release notes.
To add the contents of DebugPorts.reg to the registry, simply double-click the file. Windows creates
the appropriate key in the registry, and adds the values to it.
 WARNING!
 TCP/IP port numbers are limited to the range of 0-65535. Ports below 8000 are reserved and should not be used. So, you can use any port above 8000, assuming no other application on your system is using that port, too.
The next step is to ensure that when the native application launches
a VM session, it does so in debug mode. Modifying a native application
itself to launch the VM in debug mode is not practical. Instead,
we use the environment variable _JAVA_OPTIONS, which is new in JDK 1.2. Options defined via this environment
variable will be used any time a VM session is instantiated.
Because you may not want to always run Java sessions in debug
mode (for performance and security reasons), you will usually
want to specify the _JAVA_OPTIONS on a per session basis. The best way to do this is to use a command
(.cmd) file.
The VM Launcher Example folder contains two example command files. One is to be used
with a standard non-debug JDK 1.2; the other is for a JDK 1.2.2
installation that has the JPDA binaries installed (and hence supports
the new Sun debugger specification).
NOTE The command files require a minor modification to work correctly. The path to the JDK should be changed to the location of the JDK on your particular system. Examine the command files for more information.
Instead of launching VMLaunch.exe directly, you will launch these command files. The command files
will set the _JAVA_OPTIONS environment variable, and then launch VMLaunch.exe for you.
To show you how to attach CodeWarrior's debugger to a VM that
is embedded in a native application, we have provided a short
tutorial in the VM Launcher Example folder. Follow the steps below.
1. Import DebugPorts.reg into your registry.
In Windows Explorer, double-click the file named DebugPorts.reg. Windows creates a matching registry key.
2. Open the VMLaunch.mcp project.
3. Verify the path to your JDK.
Open VMLaunch.cpp. Make sure USE_1_2_JDK is defined, and that the LoadLibrary() call is pointing to your particular JDK installation, as only
1.2 VMs and later can be seamlessly attached to.
Choose Project > Make to build the project.
5. Verify the JDKPATH environment variable in the command file.
Open the file named LaunchMe_JPDA.cmd by right-clicking on it and choosing Edit from the resulting pop-up menu. Verify that the JDKPATH environment variable matches the location of the JDK on your
particular system. Close the file when you are done.
The LaunchMe_JPDA.cmd file is provided for attaching to a JDWP enabled VM. You may
use this file in place of LaunchMe.cmd.
From Windows Explorer, launch LaunchMe_JPDA.cmd. Ensure that the Java application runs without problems.
7. Open TrivialApplication.class
Select File > Open. The file selection dialog box is displayed. Change the Files of Type pop-up menu to Java Class Files. The dialog box displays the TrivialApplication.class file. Double-click TrivialApplication.class to open it. The browser window displays the class information
for this class.
Select Window > Process Window to open the Processes window.
Double-click on "JDWP debug port 8000 (inactive)" in the list. The debugger attaches to the VM.
The CW Java Output Window displays the output of the Java application.
Set a break point in TrivialApplication by selecting it in the browser window. The debugger takes control
and lets you step through the program.
CodeWarrior allows you to debug a Java application outside the
context of a CodeWarrior project. You can open a class file or
jar file in the IDE and launch a debug session. The Java Settings panel (Figure 7.4) provides settings to be used when debugging a Java application
in this way. The VM the debugger uses is the one in the current
Sun Java SDK, as specified by the registry string "CurrentVersion" in the [HKEY_LOCAL_MACHINE\SOFTWARE\JavaSoft\Java Development Kit] registry key.
The Debugger's Java Settings preferences panel: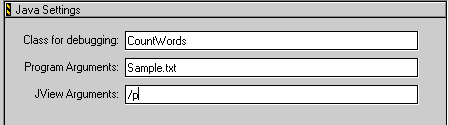
This field specifies the particular class you wish to debug.
This field specifies command-line arguments to be passed to your Java program when the debugger launches the program.
This edit field specifies arguments to be passed to the java interpreter.
Refer to the Sun JDK documentation for a list of valid switches,
or execute "java -?" in a command window.