[ First ] [ Previous ] [ Next ] [ Last ] [ Manuals ]
Debugger Settings

The following panels apply to the CodeWarrior debugger:
Other Executables
The Other Executables settings panel, shown in Figure 9.19, allows you to debug additional executable files along with the current build target.
Executable Files list
This list shows the executable files that you can debug while debugging the current build target. The list consists of two columns:
Click the Debug column to toggle debugging of the desired executable file. For each executable file, a bullet in the column indicates that debugging is enabled.
Other Executables Settings Panel: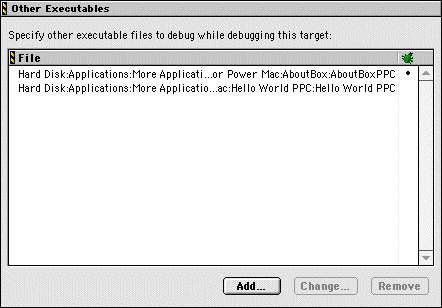
Add
To add a new executable file to the Executable Files list, follow these steps:
1. Click Add.
The Debug Additional Executable dialog box, shown in Figure 9.20, appears.
2. Enter the path to the executable file in the File Location field.
Alternatively, click Choose to display a dialog box. Use the dialog box to select the executable file. The path to the selected executable file then appears in the field.
3. Configure the Download File During Remote Debugging checkbox as desired.
Enable the checkbox to download files from a remote computer during a remote-debugging session. Enter in the Remote download path field the download path for files from the remote computer. Alternatively, click Choose to open a dialog box and select the path. Click Clear to remove the existing path from the field.
4. Configure the Debug Merged Executable checkbox as desired.
Enable the checkbox to debug a merged executable file. Specify in the field the path to the file containing the merged executable file. Alternatively, click Choose to open a dialog box and select the path. Click Clear to remove the existing path from the field.
5. Click OK.
The new executable file appears in the Executable Files list of the Other Executables settings panel.
Debug Additional Executable Dialog Box: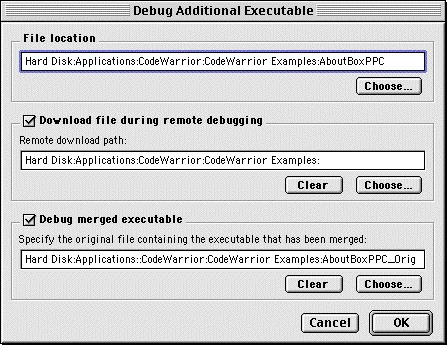
Change
To modify an existing entry in the Executable Files list, follow these steps:
1. Select the entry that you wish to modify from the Executable Files list.
2. Click Change.
Alternatively, double-click the entry. The dialog box shown in Figure 9.20 appears with the details of the entry that you wish to change.
3. Modify the entry as desired.
Click Clear to remove existing path information from each field. Click Choose to use a dialog box to select a new path.
4. Click OK.
Your modifications appear in the Executable Files list. Alternatively, click Cancel to discard your changes and return to the Executable Files list.
Remove
To remove an existing entry from the Executable Files list, follow these steps:
1. Select the entry that you wish to delete from the Executable Files list.
2. Click Remove.
The IDE deletes the selected entry from the Executable Files list.
Debugger Settings
The Debugger Settings panel, shown in Figure 9.21, includes options to log activities, change data-update intervals, and set other related options.
Location of Relocated Libraries and Code Resources
Enter in this field the path to the relocated libraries and code-resource files required by the current project. Alternatively, click Choose to open a dialog box. Use the dialog box to select the required files.
Debugger Settings Panel: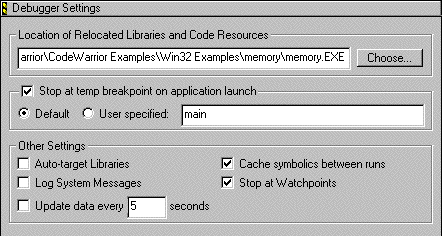
Stop at temp breakpoint on application launch
Enable this checkbox to stop program execution at a specified temporary breakpoint at the beginning of a debugging session. Click the Default radio button to always stop at the main() function, or click the User specified radio button and enter in the field the function at which you want to stop.
Auto-target Libraries
This checkbox applies to the current project when you debug a non-project file. For example, this situation can occur when you attach a running process. For more information about attaching processes, see "Processes window toolbar".
Enable the Auto Target Libraries checkbox to allow the IDE to attempt to debug dynamically linked libraries (DLLs) loaded by the target application. The IDE attempts to automatically debug the loaded DLLs for which symbolics information is available.
 NOTE
NOTE
You might notice slower IDE performance after you enable the Auto Target Libraries checkbox. If you encounter this problem, try disabling the checkbox to improve performance.
Cache symbolics between runs
Enable this checkbox to allow the debugger to cache a project's symbolics information and refer to that cached information during subsequent debugging sessions. Disable the checkbox to force the debugger to discard the project's symbolics information after each debugging session. Enabling the symbolics cache is useful for improving the performance of successive debugging sessions.
Log System Messages
Enable this checkbox to log all system messages to a file. Disable the checkbox if you do not wish to create a log file. For more information about viewing log files, see "Log Window".
NOTE
On the Windows-hosted IDE, log information includes messages about DLL loading and loading, as well as debug printf() messages. On the Mac OS-hosted IDE, log information refers to messages about the loading of PowerPC code fragments, as well as DebugStr() messages.
Stop at Watchpoints
Enable this checkbox to halt a program's execution when the debugger encounters a watchpoint, regardless of whether the watched value changes. Disable this checkbox to halt execution only when the watched value changes.
Update Data
Enable this checkbox to update the information in debugging windows after a specified time interval. Enter an interval in the Update data every x seconds field, where x represents the number of seconds you wish to elapse before the next update. Disable the checkbox if you do not wish to update the debugging information. In this case, debugging-window information stays the same throughout the debugging session.
Remote Debugging Settings Panel: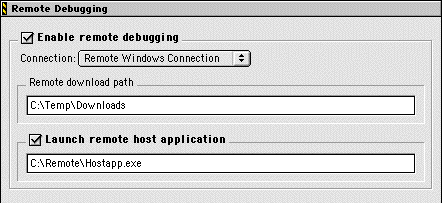
Remote Debugging
The Remote Debugging settings panel, shown in Figure 9.22, lets you define target-specific remote-debugging connections between your computer and other computers. You define these target specific connections in terms of general remote-debugging connections. Using this approach, you need only make minor changes to the general connections to maintain remote-debugging functionality.
You use the Remote Debugging settings panel in conjunction with the Remote Debugging preference panel to configure remote-debugging connections for individual projects. For more information, see "Remote Connections".
Enable remote debugging
Enable this checkbox to define a remote-debugging connection specific to the current build target. Choose from the Connection pop-up menu the general connection that you wish to use to define the target-specific connection. For more information about defining general connections, see "Remote Connections".
Remote download path
Enter in this field the path to the folder in which you wish to download files.
Launch remote host application
Enable this checkbox to launch an application on the remote computer to serve as a host application. Enter in the associated field the path to the application that you wish to launch.
[ First ] [ Previous ] [ Next ] [ Last ] [ Manuals ]
Visit the Metrowerks website at: http://www.metrowerks.com
For assistance contact Metrowerks Technical Support at: cw_support@metrowerks.com
Copyright © 2000, Metrowerks Corp. All rights reserved.
Last updated: August 17, 2000