[ First ] [ Previous ] [ Next ] [ Last ] [ Manuals ]
Debugger Preferences

This section discusses preference panels that control CodeWarrior debugger features:
Display Settings
The Display Settings preference panel, shown in Figure 8.20, provides options for configuring the CodeWarrior debugger's behavior.
Variable Change Hilite
This option lets you configure the color of changed variables that appear in debugger windows. Click the color swatch to change the current color.
Watchpoint Hilite
This option lets you configure the color of watchpoints that appear in debugger windows. Click the color swatch to change the current color.
Show variable types
Enable this checkbox to show variable types by default after opening a new Variable window.
Display Settings Preference Panel: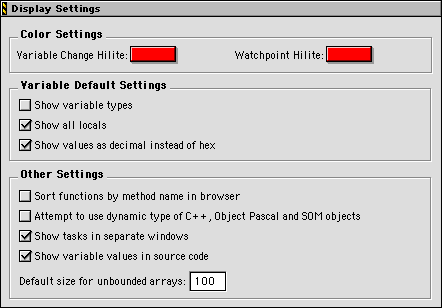
Show all locals
Enable this checkbox to show all local variables by default after opening a new Variable window. If this option is enabled, the Variables pane listing is always Variables:All. If this option is disabled, the Variables pane listing is either Variables:All, Variables:Auto, or Variables:None, depending on the previous state. See "Variables pane" for more information about these states.
Show values as decimal instead of hex
Enable this checkbox to show variable values as decimal values by default instead of as hexadecimal values.
Sort functions by method name in browser
This checkbox toggles the sorting method used for C++, Object Pascal, and Java functions in the Browser window. Disabling the checkbox causes the browser to alphabetically sort function names of the form className::methodName by class name first, then by method name. Enabling the checkbox causes the browser to alphabetically sort functions directly by method name. Since most C++, Object Pascal, and Java source-code files tend to contain methods that belong to the same class, enabling the checkbox helps you select methods by typing out method names.
Attempt to use dynamic type of C++, Object Pascal and SOM objects
Enable this checkbox to display the runtime type of C++, Object Pascal, and SOM objects. Disable the checkbox to display an object's static type only.
Show tasks in separate windows
This checkbox toggles the method used to display tasks. Enable the checkbox so that double-clicking a task in the Processes Window brings up a separate Thread Window to display the code. Disable the checkbox so that the Task pop-up menu appears at the top of the Thread window. Use this menu to choose a task to display in the Thread window.
 NOTE
NOTE
Changes to this setting do not immediately take effect. The setting at the start of a debugging session stays active for the duration of that session. If you change the setting in the middle of a debugging session, you must stop and then restart debugging in order for the change to take effect.
Show variable values in source code
Enable this checkbox to automatically display variable values in your source code. If this checkbox is disabled, the variable values do not appear.
Default size for unbounded arrays
Enter in this field the array size to use in Variable windows when viewing unbounded arrays.
Windowing Preference Panel (Windows):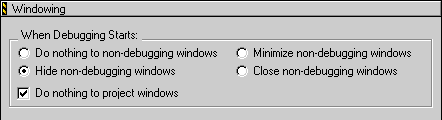
Windowing
The Windowing preference panel, shown in Figure 8.21 (Windows) and Figure 8.22 (Mac OS), allows you to configure non-debugging window behavior for the start of each debugging session. Non-debugging windows refer to windows that do not control the CodeWarrior debugger during a debugging session. Sample non-debugging windows include editor windows and the IDE Preferences window.
Do nothing to non-debugging windows
Enable this option to prevent the IDE from hiding, minimizing, collapsing, or closing non-debugging windows.
Minimize non-debugging windows (Windows)
Enable this option to minimize non-debugging windows. To expand the minimized windows, use the Window Menu, double-click the names of the minimized windows in the Project window, or perform lookups for symbols within the minimized windows. At the end of the debugging session, the IDE automatically expands the minimized windows.
NOTE
The Minimize non-debugging windows option is only available in MDI mode. For more information, see "IDE Extras" and "Use Multiple Document Interface (Windows)".
Windowing Preference Panel for Multiple Monitors (Mac OS):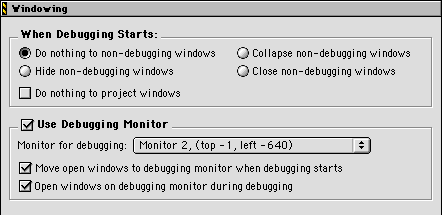
Collapse non-debugging windows (Mac OS, Solaris, and Linux)
Enable this option to collapse non-debugging windows. To expand the collapsed windows, use the Window Menu, double-click the names of the collapsed windows in the Project window, or perform lookups for symbols within the collapsed windows. At the end of the debugging session, the IDE automatically expands the collapsed windows.
Hide non-debugging windows
Enable this option to hide, but not close, non-debugging windows. To reveal the hidden windows, use the Window Menu, double-click the names of the hidden files in the Project window, or perform lookups for symbols within the hidden windows. At the end of the debugging session, the IDE automatically reveals the hidden windows.
Close non-debugging windows
Enable this option to close non-debugging windows. At the end of the debugging session, the IDE automatically re-opens the closed windows.
Do nothing to project windows
Enable this checkbox to prevent the IDE from manipulating Project windows. Since the IDE uses Project windows to initiate debugging sessions, enabling the checkbox is useful for debugging multiple build targets or projects.
Use Debugging Monitor (Mac OS)
The following options, shown in Figure 8.22, appear only when you have more than one monitor connected to your computer. These options help you manage debugging windows across your multiple-monitor setup. Enable the Use Debugging Monitor checkbox to use the IDE's multiple-monitor debugging features.
Monitor for debugging
Choose from this pop-up menu the monitor that you wish to use during debugging sessions. The coordinates in parentheses identify the selected monitor in QuickDraw space.
Move open windows to debugging monitor when debugging starts
Enable this checkbox to allow the IDE to move all open windows to the selected debugging monitor after you begin a debugging session. At the end of the debugging session, the IDE restores the moved windows to their original positions.
Open windows on debugging monitor during debugging
Enable this checkbox to display within the selected debugging monitor any window that opens during the debugging session. The IDE does not save a window's position on the debugging monitor if you close that window during the debugging session. This behavior prevents window positions from gravitating to the debugging monitor.
Global Settings
The Global Settings preference panel, shown in Figure 8.23, provides options for customizing the debugger's behavior to better suit your needs.
Global Settings Preference Panel: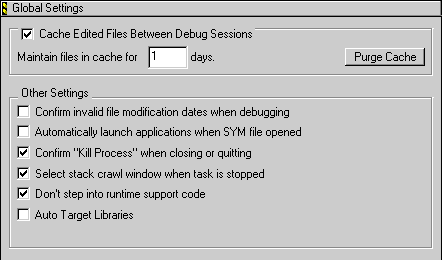
Cache Edited Files Between Debug Sessions
Enable this checkbox to maintain a cache of edited files between debugging sessions. After enabling the checkbox, enter in the Maintain files in cache for field the number of days to keep the files in the cache. Click the Purge Cache button to delete the contents of the current cache.
Confirm invalid file modification dates when debugging
The debugger keeps track of the modification dates of source files used to create a symbolics file. When the modification dates do not match, the debugger can warn you of possible discrepancies between the object code and the source code. Enable the checkbox to display the warning.
Automatically launch applications when SYM file opened
This checkbox toggles the way the debugger handles target applications after opening a symbolics file. Enable the checkbox to automatically launch a target program and set an implicit breakpoint at the program's main entry point. Disable the checkbox to open a symbolics file without launching the program, so that you can examine object code that executes before the main routine, such as C++ static constructors. You can also avoid launching the target program by holding down the Alt key (Windows, Solaris, and Linux) or Option key (Mac OS) when opening a symbolics file.
Confirm "Kill Process" when closing or quitting
Enable this checkbox to allow the debugger to prompt you for confirmation before aborting a process after you kill a target program.
Select stack crawl window when task is stopped
Enable this checkbox to automatically bring the Thread window to the foreground after the debugger stops a task. Disable the checkbox to leave the Thread window in its previous position. Enabling this checkbox is useful if you have several Variable windows open and you want to see the variables change as you step through your code. You can control the Thread window even if it is not the active window.
Don't step into runtime support code
Enable this checkbox to allow the IDE to execute constructor code for C++ static objects normally, without displaying the execution in the runtime library.
Auto Target Libraries
Enable this checkbox to allow the debugger to try debugging dynamically linked libraries (DLLs) loaded by the target application. The debugger attempts to automatically debug the loaded DLLs that have symbolics information.
Enabling this checkbox is useful if you use the debugger to debug a file that is not a project file, such as when you attach a running process. For more information about attaching processes, see "Processes window toolbar"
NOTE
You might notice slower performance when you enable the Auto Target Libraries checkbox. If you encounter this problem, try disabling the checkbox to improve the IDE's performance.
Remote Connections
The Remote Connections preference panel, shown in Figure 8.24, lets you define general remote-debugging connections between your computer and other computers. You can use these general connections to define more specific connections for individual projects. Using this approach, you need only make minor changes to the general connections to maintain remote-debugging functionality.
You use the Remote Connections preference panel in conjunction with the Remote Debugging settings panel to configure remote-debugging connections for individual projects. For more information, see "Remote Debugging".
Remote Connections Preference Panel: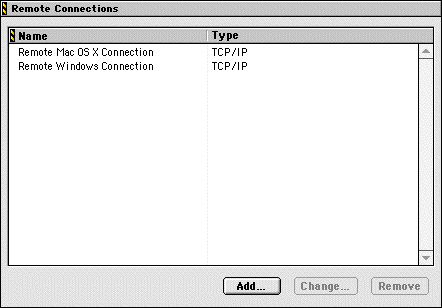
Remote Connections list
This list shows all remote connections defined for use with the IDE. The list contains two columns:
Add
To add a new remote connection, follow these steps:
1. Click Add.
The New Connection dialog box, shown in Figure 8.25, appears.
2. Enter a name for the new remote connection in the Name field.
On the Mac OS-hosted IDE, the name of the New Connection dialog box changes to reflect the name that you enter in the field.
3. Choose the desired debugging nub from the Debugger pop-up menu.
The debugging nub provides low-level debugging services to the IDE. For example, the debugging nub allows the IDE to set breakpoints and watchpoints in source code.
4. Configure the Browse In Process Window checkbox as desired.
Enable the checkbox to view the remote connection as a process in the Processes window. Disable the checkbox to prevent the remote connection from appearing in the Processes window. For more information about the Processes window, see "Processes Window".
5. Choose the desired connection type from the Connection Type pop-up menu.
The connection type that you choose determines the remaining options that appear in the dialog box. Complete these options as desired.
New Connection Dialog Box: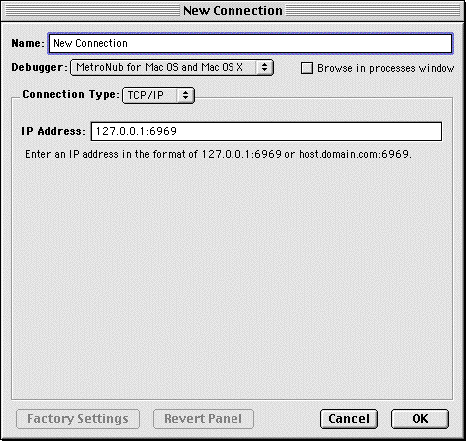
6. Click OK to add the new remote connection to the Remote Connections list.
Repeat these steps until you finish adding general remote connections, then click Save. You can then define project-specific connections in terms of the general connections.
Change
To modify an existing remote connection, follow these steps:
1. Select the connection that you wish to modify from the Remote Connections list.
2. Click Change.
Alternatively, double-click the connection's name. The dialog box shown in Figure 8.25 appears with the details of the connection that you wish to change.
3. Modify the remote connection as desired.
To restore the factory default settings for the remote connection, click Factory Settings. To restore the dialog box to its last saved state, click Revert.
4. Click OK.
Your modifications appear in the Remote Connections list. Alternatively, click Cancel to discard your changes and return to the Remote Connections list.
Repeat these steps until you finish modifying general remote connections, then click Save. You can then define project-specific connections in terms of the general connections.
Remove
To remove an existing remote connection, follow these steps:
1. Select the remote connection that you wish to delete from the Remote Connections list.
2. Click Remove.
The IDE deletes the selected remote connection from the Remote Connections list.
Repeat these steps until you finish deleting general remote connections, then click Save to commit your changes.
Java Settings Preference Panel: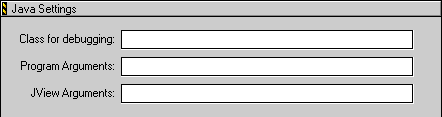
Java Settings (Windows)
The Java Settings preference panel, shown in Figure 8.26, lets you configure general Java debugger options. For more information about debugging Java programs and applets, see Targeting Java.
Class for debugging
Enter in this field the class file that you wish to debug.
Program Arguments
Enter in this field the command-line arguments to be used by your project when debugging a Java application.
JView Arguments
Enter in this field any arguments JView might require while debugging your project.
Java Debugging (Windows and Mac OS)
The Java Debugging preference panel, shown in Figure 8.27, allows you to set up your computer for connecting to a virtual machine for Java debugging sessions. For more information about Java debugging, refer to Targeting Java.
Timeout
Enter in this field the number of seconds that the CodeWarrior debugger should wait for a virtual machine to attach to it.
Java Debugging Preference Panel: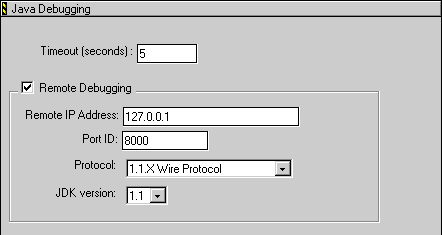
Remote Debugging
Enable this checkbox to enable remote debugging of Java projects from your computer.
Remote IP Address
Use this field if you have a network connection to the virtual machine you plan to use for debugging. Enter in this field the Internet Protocol (IP) address of the computer on which the virtual machine is running. This field becomes available only after you enable the Remote Debugging checkbox.
Port ID
Use this field if you have a network connection to the virtual machine you plan to use for debugging. Enter in this field the port ID number to be used for the connection between the virtual machine and the CodeWarrior debugger. This field is enabled only after you enable the Remote Debugging checkbox.
Protocol (Windows)
Choose from this pop-up menu the desired protocol for transmissions between your computer and the remote virtual machine during the debugging session. This pop-up menu becomes available only after you enable the Remote Debugging checkbox.
JDK version (Windows)
Choose from this pop-up menu the Java Development Kit (JDK) version to use during the remote debugging session. This pop-up menu becomes available only after you enable the Remote Debugging checkbox and choose the 1.1.X Wire Protocol from the Protocol pop-up menu.
MetroNub Settings (Windows and Mac OS)
The MetroNub Settings preference panel, shown in Figure 8.28, allows you to configure the CodeWarrior debugger nub. The nub provides low-level debugging services, such as setting breakpoints and watchpoints.
MetroNub Settings Preference Panel: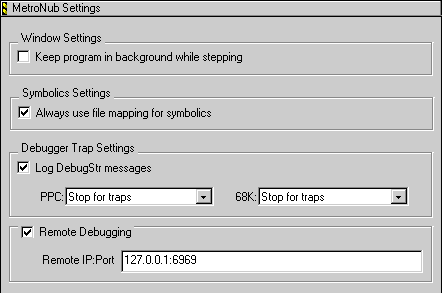
Keep program in background while stepping
Enable this checkbox to step through a program's code while the program runs in the background. This option accelerates stepping and avoids screen flicker. If you disable the checkbox, the program's windows briefly come to the foreground and then return to the background. With rapid stepping, the constant movement of the program's windows could cause screen flicker.
 WARNING!
The Keep program in background while stepping option might affect the execution of a program that behaves differently in the background and in the foreground.
Always use file mapping for symbolics
This checkbox determines whether MetroNub or the IDE handles symbolics files. Enable the checkbox to let MetroNub handle the files. Disable the checkbox to let the IDE handle the files.
Debugger Trap Settings
These settings determine how the debugger handles Debugger() and DebugStr() traps during program execution.
Log DebugStr messages
Enable this checkbox to log DebugStr() messages encountered during a program's execution. If you do not want to log these messages, disable the checkbox.
PPC
Use this pop-up menu to determine how the debugger handles PowerPC traps. You can choose to let MacsBug handle the traps (MacsBug handles traps), halt the program's execution after executing the traps (Stop for traps), or disregard the traps and continue the program's execution (Ignore traps).
68K
Use this pop-up menu to determine how the debugger handles 68K traps. You can choose to let MacsBug handle the traps (MacsBug handles traps), halt the program's execution after executing the traps (Stop for traps), or disregard the traps and continue the program's execution (Ignore traps).
Remote Debugging (Windows)
Enable this checkbox to enable remote debugging of Mac¨ OS 8, Mac OS 9, or Mac OS X projects from your computer.
Remote IP:Port
Enter in this field the Internet Protocol (IP) address of the remote computer, followed by a colon, followed by the port ID number of the remote computer. The field shows a sample value.
x86 Settings (Windows and Mac OS)
The x86 Settings preference panel, shown in Figure 8.29, provides settings for connecting a Mac OS computer to a remote Windows computer for debugging sessions. To learn more about this preference panel, refer to Targeting Mac OS.
x86 Settings Preference Panel: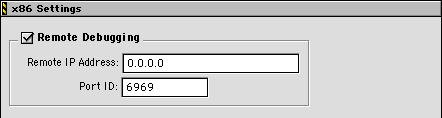
Remote debugging
Enable this checkbox to enable remote debugging of Windows projects from your computer.
Remote IP Address
Enter in this field the Internet Protocol (IP) address of the remote computer.
Port ID
Enter in this field the port ID number of the remote computer.
NOTE
You should leave the port ID number at its default setting. Changing the default number might cause CodeWarrior to fail to connect to the remote computer.
[ First ] [ Previous ] [ Next ] [ Last ] [ Manuals ]
Visit the Metrowerks website at: http://www.metrowerks.com
For assistance contact Metrowerks Technical Support at: cw_support@metrowerks.com
Copyright © 2000, Metrowerks Corp. All rights reserved.
Last updated: August 17, 2000