[ First ] [ Previous ] [ Next ] [ Last ] [ Manuals ]
Processes Window

The Processes window (Figure 11.19) lists currently running processes, including some hidden processes. The Processes window also lists tasks for a selected process. To open the Processes window, use one of the following techniques:
The Processes window has two panes and a toolbar:
Processes window toolbar-allows you to run, stop, or kill processes and tasks under debugger control. The toolbar also lets you attach processes and open Stack Crawl windows.
Process pane-shows currently running processes
Task pane-shows tasks in a selected process
Processes Window: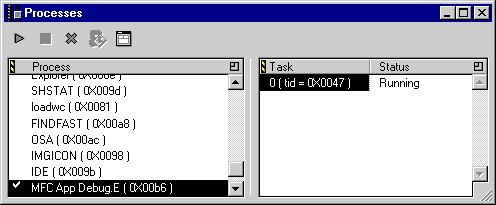
Processes window toolbar
The Processes window toolbar (Figure 11.20) has controls to
Processes Window Toolbar: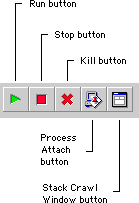
The Process Attach button assigns a debugging session to the selected process in the Process pane. This button is useful for debugging processes that the debugger cannot recognize normally. For example, when debugging a program that uses dynamic link libraries or shared libraries, you can use the Process Attach button to place those libraries under debugger control. A check mark appears next to attached processes.
The Thread window button opens a Thread window for the selected process or task. You can have multiple Thread windows open at a time. After clicking the button, the Stack Crawl window for the selected process or task appears frontmost.
Process pane
The Process pane lists all currently running processes. A checkmark appears next to each process under debugger control. To place a selected process under debugger control, click the Process Attach button. Double-clicking a process name activates that process.
Process Pane: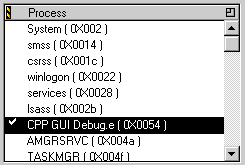
Task pane
The Task pane lists all the currently running tasks for a given process. Only tasks from programs under debugger control are shown. Double-clicking a task name opens a Thread window with the code for that task. You can also choose a task and then click the Thread window button (Figure 11.20).
Task Pane: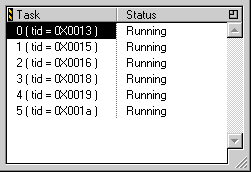
There are two columns in the Task pane. The left column shows the task ID. The right column indicates the task status as either running, stopped, or crashed.
[ First ] [ Previous ] [ Next ] [ Last ] [ Manuals ]
Visit the Metrowerks website at: http://www.metrowerks.com
For assistance contact Metrowerks Technical Support at: cw_support@metrowerks.com
Copyright © 2000, Metrowerks Corp. All rights reserved.
Last updated: August 17, 2000