[ First ]  [ Previous ]  [ Next ]  [ Last ]  [ Manuals ]


Viewing and Changing Data

A critical feature of a debugger is the ability to see the current values of variables, and to change those values when necessary. This ability allows you to understand the details of your program's execution, and to experiment with new possibilities.

This section discusses the following topics:

For additional information on viewing and changing data for a particular target, see the corresponding Targeting manual.


Viewing local variables

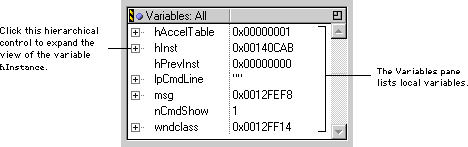
Local variables are displayed in the Variables pane of the Thread window (Figure 11.60). If the variable is a handle, pointer, or structure, you can click the hierarchical control to the left of the name to expand the view. This allows you to see the members of the structure, or the data referenced by the pointer or handle.

To learn some useful tips for using hierarchical controls, see "Expanding and Collapsing Groups". For more information about the Variables pane of the Thread window, refer to "Variables pane."

Viewing Local Variables:
Viewing global variables

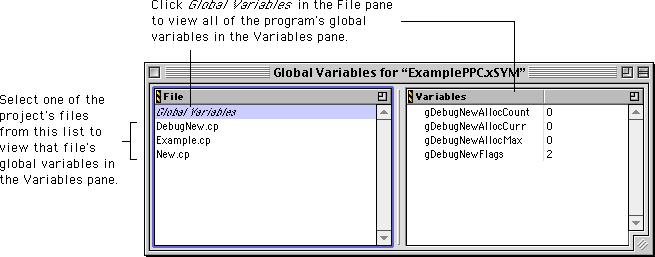
To view global variables, open the Global Variables window. Use one of the following techniques:

Next, click the Global Variables item in the File pane (Figure 11.61). Then, the Variables pane displays the global variables in your program.

For more information, see "Global Variables Window".

Viewing Global Variables:
Placing data in a new window

Sometimes the Variables pane and Global Variables window are not the most convenient places to view data. You can place any variable or group of variables in a separate window.

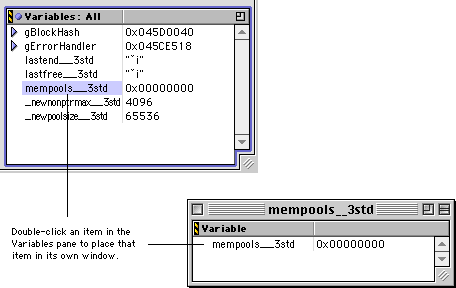
To place a variable or memory location in its own window, double-click its name (Figure 11.62) or select the name and choose Data > View Variable, or choose the View Variable command from the debugger contextual menu (Figure 11.18). If the variable is an array, use the View Array command instead. To view the memory the variable occupies as a memory dump, use either the View Memory or View Memory As command.

For more information, see "Variable Window," "Array Window," and "Memory Window".

Placing a Variable in Its Own Window:
Viewing data types

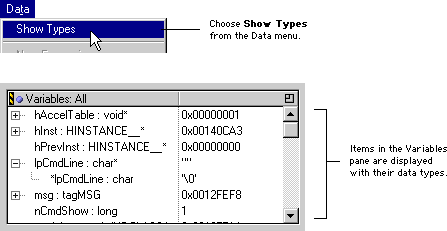
If you wish, the debugger can display the data types of variables on a window-by-window basis. Select the window or pane in which you want data types displayed and choose Data > Show Types, or choose the Show Types command from the debugger contextual menu (Figure 11.18). Then, the relevant data type follows the names of the variables and memory locations in that window or pane (Figure 11.63).
Viewing Data Types:

TIP

To show data types automatically, enable the following preference in the Display Settings preference panel of the IDE Preferences window:

In variable panes, show variable types by default

See "Display Settings" for more information.

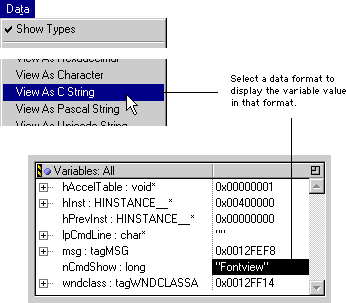
Selecting a Data Format:
Viewing data in a different format

You display a variable's value in several formats:

To view data in a particular format, select either the name or the value of the variable in any window in which it is displayed, then choose the format from the Data menu (Figure 11.64) or the debugger contextual menu (Figure 11.18).

Not all formats are available for all data types. For example, if a variable is an integral value (such as type short or long), you can view it in signed decimal, unsigned decimal, hexadecimal, character, or string format. However, you cannot view the same variable in floating-point, Fixed, or Fract format.


Viewing data as different types

The View As command in the Data menu lets you change the data type in which a variable, register, or memory value appears:

1. Select the item in a window or pane.

2. Choose Data > View As.

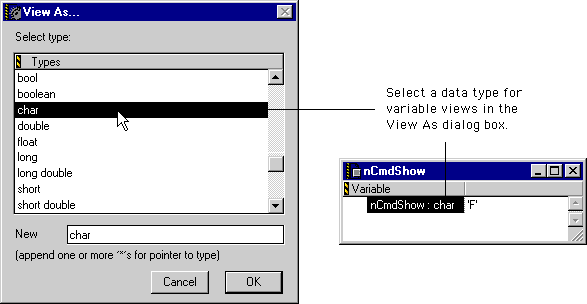
Alternatively, you can use the debugger contextual menu (Figure 11.18) to select the same command. After you choose the View As menu command, the debugger displays the View As dialog box, shown in Figure 11.65.

3. Select the data type by which to view the item.

The data type you select is displayed in the New Type text field near the bottom of the dialog box. If you want to treat the item as a pointer, append an asterisk (*) to the type name.

4. Click OK.

The display of the item's value changes to the specified type.

Selecting a Data Type:
Changing the value of a variable

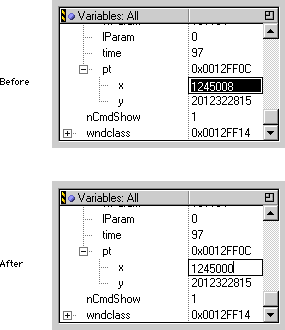
You can change the value of a variable in any variable view. Variables are displayed in several debugging windows: the Variables pane of the Thread window or Symbolics window, a Variable window, an Array window, or the Expressions window. To change the value, double-click the variable (or select it and press Enter/Return) and type the new value (Figure 11.66).

You can enter variable values in any of the following formats:
To enter a string or character constant, you must include C-style quotation marks (single quotes '' for a character constant, double quotes "" for a string). For Pascal strings, include the escape sequence \p as the first character in the string.


WARNING!

Changing variable values can be dangerous. The debugger allows you to set a variable to any value of the appropriate data type. For example, you could set a pointer to nil and crash the machine.

Using the Expressions window

The Expressions window provides a single place to put frequently used local variables, global variables, structure members, array elements, and complex expressions. To open this window, use one of the following techniques:

You can add an item to the Expressions window in the following ways:

  • Choose Data > New Expression.
  • Drag and drop an item from another window.
  • Select an item and choose Data > Copy to Expression.
  • Choose the Copy to Expression command from the debugger contextual menu (Figure 11.18).
  • The IDE updates the contents of the Expressions window whenever execution stops in the debugger. The IDE leaves blank any variable that is out of scope. You can use the Expressions window to perform a number of tasks:

  • Move a routine's local variables to the Expressions window before expanding them to observe their contents. When the routine exits, its variables remain in the Expressions window and are still expanded when execution returns to the routine. The Expressions window does not automatically collapse local variables when execution leaves a routine, like the Variables pane in the Thread window.
  • Keep multiple copies of the same item displayed as different data types, by using the Copy to Expression and View As commands in the Data menu and the debugger contextual menu.
  • Keep a sorted list of items. You can reorder items by dragging them within the Expressions window.
  • View local variables from calling routines. You don't have to navigate back up the calling chain to display a caller's local variables (which hides the local variables of the currently executing routine). Add the caller's local variables to the Expressions window to view them without changing levels in the Stack Crawl pane.
  • For more information, see "Expressions Window".


    Viewing raw memory

    To examine and change the raw contents of memory:

    1. Select an item or expression representing the base address of the memory you want to examine.

    2. Choose Data > View Memory.

    A new Memory window opens and displays the contents of memory in hexadecimal and ASCII format. You can change memory directly from the Memory window by entering hexadecimal values or characters. You can also change the beginning address of the memory being displayed by changing the expression in the Display text field at the top of the window.


    Viewing memory at an address

    The View Memory and View Memory As commands in the Data menu allow you to follow any pointer-including an address stored in a register-and view the memory to which it currently points.

    To display the memory referenced by a pointer, follow these steps:

    1. Select the value of the variable or register in a window in which it appears.

    2. Choose Data > View Memory or Data > View Memory As.

    If you choose the View Memory menu command, stop with this step. A Memory window opens and displays a raw memory dump, starting at the address referenced by the pointer.

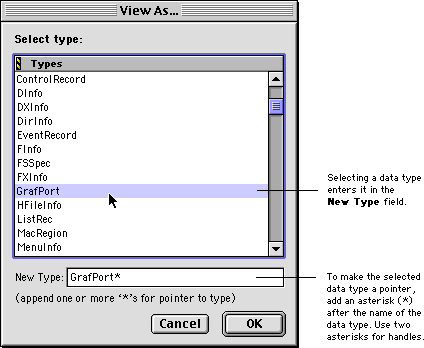
    If you choose the View Memory As menu command, continue to the next step. A dialog box (Figure 11.67) opens and prompts you to select a data type.

    3. If you chose Data > View Memory As, select a data type in the View As dialog box.

    The data type you select appears in the New Type field. To view the memory pointed to by a register, append an asterisk (*) to the type name.

    4. Click OK in the View As dialog box.

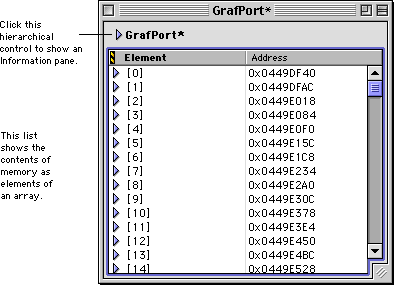
    A new window opens (Figure 11.68) and displays the contents of memory, starting at the address referenced by the pointer.

    Choosing a Data Type to View Memory:
    NOTE

    You can use this technique to view the contents of the stack. If your target processor stores the stack pointer in a particular register, select the value of that register. Then follow the previously described steps.

    For more information, refer to "Memory Window".

    Viewing Memory as a Specified Data Type:
    Viewing Processor Registers

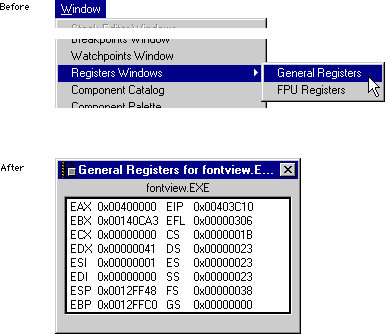
    To view the contents of the processor's general registers, choose Window > Registers Windows > General Registers (Figure 11.69).

    For more information, see "Register Windows".

    Viewing General Processor Registers:
    [ First ]  [ Previous ]  [ Next ]  [ Last ]  [ Manuals ]

    Visit the Metrowerks website at: http://www.metrowerks.com
    For assistance contact Metrowerks Technical Support at: cw_support@metrowerks.com
    Copyright © 2000, Metrowerks Corp. All rights reserved.

    Last updated: August 17, 2000