[ First ] [ Previous ] [ Next ] [ Last ] [ Manuals ]
Breakpoints Window

The Breakpoints window (Figure 11.25) lists the breakpoints in your current build target by source file and line number. To open the Breakpoints window, use one of the following techniques:
A breakpoint marker appears to the left of each listing. Clicking a breakpoint marker toggles its current status. A solid dot indicates that the breakpoint is active, while a circle that indicates that the breakpoint is inactive. In either case, the IDE remembers the position of the breakpoints in the program.
Breakpoints Window: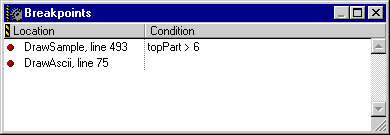
You can also manipulate breakpoints with the following techniques:
(Windows, Solaris, and Linux) In the Breakpoints Window, Alt-click one of the breakpoint markers to simultaneously activate or de-activate all listed breakpoints
(Mac OS) In the Breakpoints Window, Option-click one of the breakpoint markers to simultaneously activate or de-activate all listed breakpoints
Double-click a breakpoint listing to display the corresponding source-code line in an editor window.
Each breakpoint can have an attached condition. If the condition is true and the breakpoint is active, the breakpoint stops program execution. If the breakpoint is inactive or the condition is false, the breakpoint has no effect.
For more information, see "Breakpoints," "Show Breakpoints," "Hide Breakpoints," and "Conditional breakpoints."
[ First ] [ Previous ] [ Next ] [ Last ] [ Manuals ]
Visit the Metrowerks website at: http://www.metrowerks.com
For assistance contact Metrowerks Technical Support at: cw_support@metrowerks.com
Copyright © 2000, Metrowerks Corp. All rights reserved.
Last updated: August 17, 2000