[ First ] [ Previous ] [ Next ] [ Last ] [ Manuals ]
Breakpoints

A breakpoint suspends execution of a program and returns control to the debugger. When the debugger reaches a statement with a breakpoint, it stops the program before the statement is about to execute. The debugger then displays the routine containing the breakpoint in the Thread window. The current-statement arrow moves to the line containing the breakpoint and points to the next statement that is ready to execute.
This section discusses:
Setting and clearing breakpoints
From the Source pane of the editor window, Thread window, or Symbolics window, you can set a breakpoint on any line with a dash marker-the short line to the left of a statement in the Breakpoint column (see Figure 11.54). The dash becomes a dot (on color monitors, the default dot color is red). This dot indicates that a breakpoint has been set at this statement. Execution will stop just before this statement is executed.
Setting Breakpoints: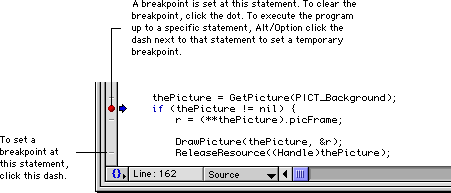
Another way to set a breakpoint is to click a particular line of source code in the Thread window and choose Debug > Set Breakpoint
A third way to set a breakpoint is to choose Debug > Set/Clear Breakpoint
 TIP
TIP
You can also use the Set/Clear Breakpoint dialog box to clear previously set breakpoints. Enter the address or symbol at which a breakpoint is currently set, and click OK. The debugger removes the specified breakpoint.
Set/Clear Breakpoint Dialog Box: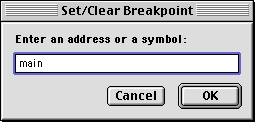
To clear a single breakpoint, click the breakpoint dot in the Source pane. The dot turns back into a dash, indicating that you have removed that breakpoint.
You can manipulate breakpoints with the following commands in the Debug menu:
In addition, you can use the debugger contextual menu in source code views and the Breakpoints window to choose the same menu commands. For more information, see "Debugger Contextual Menu".
TIP
Put one statement on each line of code. This makes your code not only easier to read, but also easier to debug. The debugger allows only one breakpoint per line of source code, no matter how many statements a line contains.
Temporary breakpoints
Regular breakpoints stop a program's execution each time you debug your project. However, you can also set temporary breakpoints that stop a program's execution only once. After reaching the temporary breakpoint, the debugger stops the program and then removes the temporary breakpoint.
You can set a temporary breakpoint in the following ways:
 NOTE
NOTE
If you set a temporary breakpoint on a source-code line that already contains a regular breakpoint, you can remove the regular breakpoint without affecting the temporary breakpoint.
If the debugger encounters other breakpoints before reaching the temporary breakpoint, program execution stops at each breakpoint. The debugger removes the temporary breakpoint after reaching it and halting program execution.
Viewing breakpoints
To see a list of all active breakpoints in your program, open the Breakpoints window. Use one of the following techniques:
The debugger displays a window that lists the source file and line number for each breakpoint (Figure 11.56). Clicking a breakpoint marker in the Breakpoints window toggles the breakpoint's status between active and inactive. A dot indicates that the breakpoint is active. The debugger stops the program's execution upon reaching an active breakpoint. A circle indicates that the breakpoint is inactive. The debugger continues to execute the program without stopping at an inactive breakpoint. The debugger remembers the position of inactive breakpoints in the program.
NOTE
Double-clicking a breakpoint location in the Breakpoints window will take you to that line of code in the Thread window or Symbolics window.
For more information, see "Breakpoints Window."
Displaying the Breakpoints Window: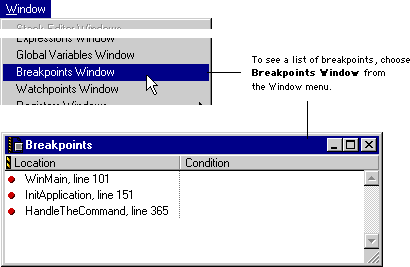
Conditional breakpoints
You can set conditional breakpoints that stop your program's execution at a given point only when a specified condition is met. A conditional breakpoint is an ordinary breakpoint with a conditional expression attached. If the expression evaluates to a true (nonzero) value when control reaches the breakpoint, the program's execution stops; if the value of the expression is false (zero), the breakpoint has no effect and program execution continues.
Conditional breakpoints are created in the Breakpoints window. To specify a conditional breakpoint:
1. Set a breakpoint at the desired statement.
2. Open the Breakpoints window.
Choose View > BreakpointsWindow > Breakpoints Window (Macintosh menu bar layout) to open the Breakpoints window.
3. In the Breakpoints window, double-click the breakpoint's Condition field.
4. Enter an expression in the Condition field.
Alternatively, drag an expression from a source-code view or from the Expressions window to the Condition field.
In Figure 11.57, the debugger stops execution at line 162 in the NewBall() routine if and only if the variable newTop is greater than six.
Creating a Conditional Breakpoint: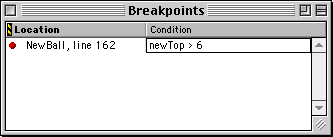
NOTE
Conditional breakpoints are especially useful when you want to stop execution inside a loop, but only after going through several iterations of that loop. You can set a conditional breakpoint inside the loop that stops the program's execution when the loop index reaches the desired value.
Setting breakpoints for templated or re-defined functions
You can set breakpoints for templated functions and re-defined functions.
Suppose you have a file named file.h that defines a function void FOO(args), where FOO is a macro. If you enter the code shown in Listing 11.1, a pop-up menu appears in the Breakpoints column during the debugging session. Use this pop-up menu to set a breakpoint for function1 or function2.
Example for Templated and Re-defined Functions:
#define FOO function1
#include file.h
#define FOO function2
#include file.h
Impact of optimizing code on breakpoints
In order to accurately set breakpoints, the debugger relies on a direct correspondence between source code and object code. Optimizing your code can disrupt this relationship and cause problems when setting breakpoints.
If there is no breakpoint dash to the left of a line of source code, you cannot set a breakpoint at that line. The potential causes are:
The code optimization cause is the most common. For example, the PowerPC compiler lets you set a breakpoint when the start of a source statement corresponds to the start of a "statement block" that has at least one instruction in it. (You do not need to understand the term "statement block" in this example.)
Normally, when debugging information is enabled for a source file, the compiler tries to start a new statement block at each source statement that actually generates some code. For example, consider the source code in Listing 11.2:
Sample Code with Breakpoints:
	-	int i = 1;
	-	if (i)
			{									//This is the third line.
				int k;
	-			int j = 1;
	-			i = j;
			}
Since the third line does not generate instructions, it does not have a unique object code address. Therefore, the debugger does not permit a breakpoint on that line.
After you start optimizing the code, the situation changes. For example, when you enable Instruction Scheduling in the project's Global Optimizations preference panel, the compiler no longer starts a new basic block for each source statement. The scheduler gains the maximum flexibility for reordering instructions within the block. The different instructions that correspond to a source statement are no longer consecutive. Instead, they are intermingled with the instructions from other source statements. Because of these optimizations, the debugger no longer displays breakpoint dashes as shown in Listing 11.2.
When you enable additional optimizations, the source statements may not even appear in the generated code. For example, consider the following code:
Sample Code with a Loop:
		i = 0;
		j = 0;
		while (i < 10)
		{
				 	 j = j + 1;
				 	 i = i + 1;
		}
With minimal optimization, the compiler translates the code from Listing 11.3 into the following equivalent code:
	j = j + 1;        // duplicate 10 times
	j = j + 1;
	.
	.
	.
	j = j + 1;
With even more optimization, the compiler totally eliminates instructions corresponding to the while loop and uses the following equivalent code:
j = 10;
While debugging your code, you should disable optimizations or use optimizations that are "debug safe." Different optimizations are available for different build targets. See the appropriate Targeting manual for additional details, as described in "Targeting Documentation".
You can view the current optimizations for your project in the Global Optimizations preference panel of the Target Settings window. For more information, refer to "Configuring Target Options".
After setting a breakpoint, you can continue debugging the program. Refer to "Running, Stepping, and Stopping Code" for additional details.
[ First ] [ Previous ] [ Next ] [ Last ] [ Manuals ]
Visit the Metrowerks website at: http://www.metrowerks.com
For assistance contact Metrowerks Technical Support at: cw_support@metrowerks.com
Copyright © 2000, Metrowerks Corp. All rights reserved.
Last updated: August 17, 2000