[ First ]  [ Previous ]  [ Next ]  [ Last ]  [ Manuals ]


Starting Up

The steps you follow to start up the debugger depend on the build target you wish to debug. Usually, the debugger requires a project file and a symbolics file in order to successfully debug a project. Some embedded build targets do not require these files to start a debugging session.

Refer to "General start-up process" to learn about the typical start-up process for debugging a project. If you wish to debug an embedded build target, refer to "Embedded start-up process" and the Targeting manual appropriate for your particular build target.


General start-up process

To use the debugger, first open a project. Next, choose Project > Enable Debugger. Then, choose Project > Debug to debug the project.

When using the debugger with your code, pay careful attention to what happens. The following situations can occur:

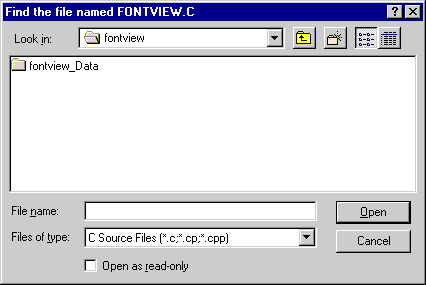
The debugger might ask you for the location of a particular file, as shown in Figure 11.36 (Windows) or Figure 11.37 (Mac OS).

You might see this dialog either upon startup (the debugger is looking for the file with the main entry point) or by clicking on a specific file in the Symbolics Window.

The debugger might ask you to locate files in these situations:

  • a file has been moved to a different directory
  • you received the project from another person in your team and the paths are different
  • you selected a file belonging to a compiled library and you do not have the source files
  • The last case is most common if you compile a build target with symbolics-file generation enabled for a library. This case is especially true with some of the libraries distributed with CodeWarrior.

    Once you find the file, the debugger remembers the new location, even between debugging sessions.

    For more information, see "Generating Symbolics Information".

    Find the File (Windows):
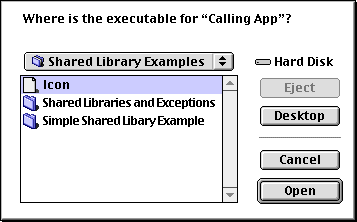
    Where is the Executable? (Mac OS):

    Embedded start-up process

    The typical debugging procedure described in "General start-up process" applies to most embedded projects as well. However, for some embedded build targets, you do not need to create a project file or generate symbolics information in order to debug a project. In such cases, the IDE creates a default project with default debugging settings. The debugger uses these default settings during the debugging session.

    Additionally, the debugger lets you download and run an executable file without using symbolics information. For more information, refer to the Targeting manual appropriate for your particular build target.


    [ First ]  [ Previous ]  [ Next ]  [ Last ]  [ Manuals ]

    Visit the Metrowerks website at: http://www.metrowerks.com
    For assistance contact Metrowerks Technical Support at: cw_support@metrowerks.com
    Copyright © 2000, Metrowerks Corp. All rights reserved.

    Last updated: August 17, 2000