
The Symbolics window, shown in Figure 11.12, appears after you open a file that contains symbolics information.
The Symbolics window somewhat resembles the Thread window in both appearance and functionality, but displays different information. The Symbolics window lets you view any file in the build target for which the IDE generated a symbolics file, whereas the Thread window only displays the file containing the routine selected in the Stack Crawl pane. The Symbolics window lets you view or edit all global variables for each project that contains symbolics information; the Thread window lets you change only those global variables referenced by active routines in the call chain. For more information about viewing global variables, see "Global Variables Window".
Symbolics Window: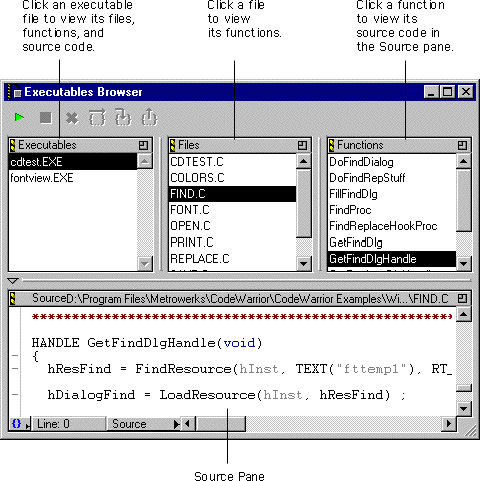
 NOTE
NOTE
.xSYM or .iSYM to the names of these files.
.EXE to the names of these files.
 TIP
TIP
The Symbolics window contains the following items:
Like the Thread window, the Symbolics window has a debugger toolbar, a Function pop-up menu, a line-number button, and a Source pop-up menu. Click and drag the resize bar between two panes to change their sizes. On the Mac OS-hosted IDE, the active pane has a heavy border.The debugger allows more than one symbolics file to be open at a time, meaning that you can debug more than one program at a time. For example, you can use this feature to debug an application and its plug-ins all at the same time. The Executables pane lists each program that contains symbolics information.
To learn more about the contents of the Thread window, see "Thread Window".
The Executables pane, shown in Figure 11.13, lists recently used executable files that contain symbolics information. Select an executable file in the list to display information about that file in the Files pane, Functions pane, and Source pane.
Executables Pane: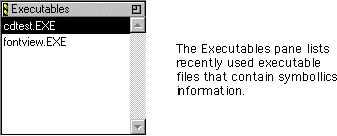
The Files pane, shown in Figure 11.14, lists the source-code files in the build target being debugged, for the selected executable file. After you select a file in this pane, the Functions pane lists the routines declared in the file. Use the Files pane in conjunction with the Functions pane and the Source pane to set breakpoints in your program.
For more information, see "Global Variables Window" and "Breakpoints."
Files Pane: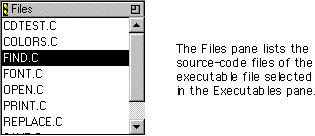
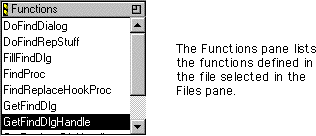
The Functions pane, shown in Figure 11.15, lists the functions defined in the file selected in the Files pane. Click a function name to display that function's declaration in the Source pane.
NOTE
className::methodName by methodName instead of by className.
The Source pane, shown in Figure 11.16, allows you to view the contents of the source-code file selected in the Files pane. You can use the Source pane to set breakpoints in any file listed in the Files pane. To learn about setting breakpoints, see "Breakpoints."
Source Pane: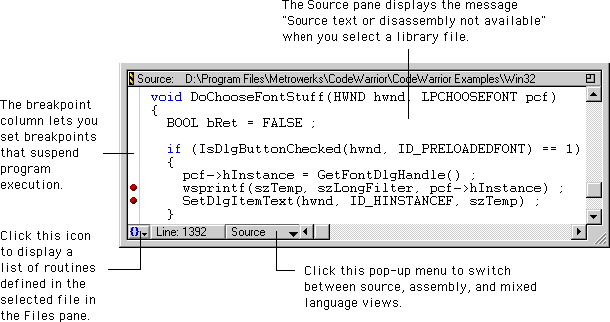
The Source pane in the Symbolics window does not show the currently executing statement. The current-statement arrow in the Thread window shows the currently executing statement. You can also use the Thread window to view local variables. For more information, see "Thread Window".
The Source pane displays code in the font and colors specified in the panels of the IDE Preferences window. For more information, see "Editor Settings" and "Display Settings".
For more information about other controls in the Source pane, see "Function Pop-Up Menu", "Line and Column Indicator", and "Source pop-up menu".