To step through your code, you can use the debugger toolbar buttons, the keyboard, or choose the appropriate menu command. Figure 11.4 lists the debugger toolbar buttons.
This section discusses the following topics:
The current-statement arrow in the Thread window (Figure 11.38) indicates the next statement to be executed. It represents the processor program-counter register. When you start a debugging session, the current-statement arrow points to the first line of executable code in your program.
Current-statement Arrow: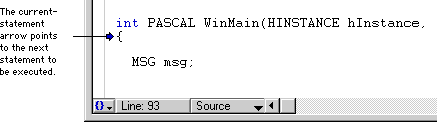
If the program is running but its execution has stopped, use the Run command (Figure 11.39) to restart your program. The program resumes execution at the current-statement arrow.
Run Command: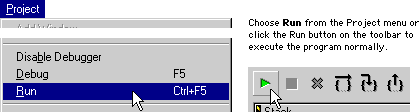
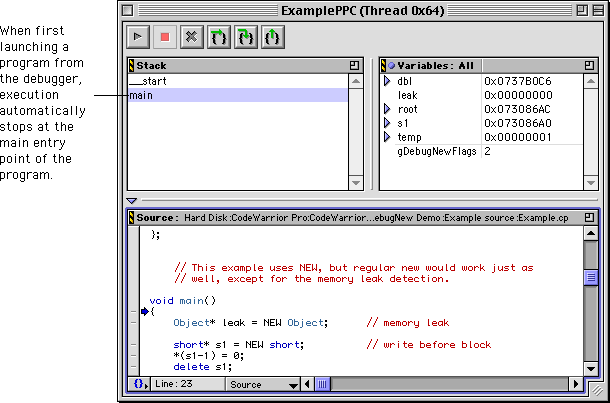
After a breakpoint or a Stop command, the debugger regains control and displays the Thread window with the current-statement arrow and the current values of variables. The debugger places an implicit breakpoint at the main entry point of the program and stops there (Figure 11.40). Issuing another Run command resumes program execution from the point of the interruption. After a Kill command, Run restarts the program from its beginning.
 TIP
TIP
To execute one statement, use the Step Over command (Figure 11.41). If the statement is a routine call, the entire called routine executes and the current-statement arrow proceeds to the next line of code. In other words, the Step Over command executes a routine call without visiting the code in the called routine. This behavior holds true if the routine does not have breakpoints and does not call other routines. When you step over code and reach the end of a routine, the current-statement arrow returns to the routine caller.
Step Over Command: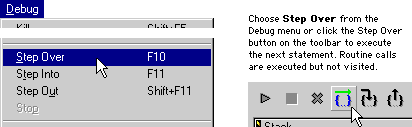
Sometimes you want to follow execution into a called routine. To execute one statement at a time and follow execution into a routine call, use the Step Into command (Figure 11.42).
Step Into Command: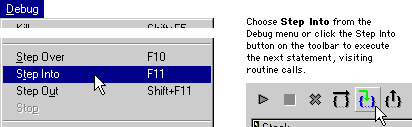
To execute statements until the current routine returns to its caller, use the Step Out command (Figure 11.43). Step Out executes the rest of the current routine normally and stops the program when the routine returns to its caller. You go one level back up the calling chain. See "Call-chain navigation" for more information.
Step Out Command: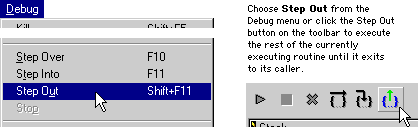
 WARNING!
One way of skipping statements is to drag the current-statement arrow to a new position, as shown in Figure 11.44. Note that dragging the current-statement arrow up or down does not execute the statements between the original arrow position and its new position.
Dragging the Current-statement Arrow: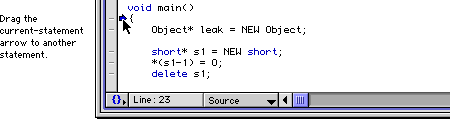
To move the current-statement arrow without potentially corrupting the run-time environment, Alt/Option click a statement in the Breakpoint column (Figure 11.45). Alt/Option clicking the statement sets a temporary breakpoint: Execution proceeds normally until the current-statement arrow reaches the temporary breakpoint, then stops. After execution stops, the debugger automatically removes the temporary breakpoint. For more information, see "Breakpoints".
Setting a Temporary Breakpoint: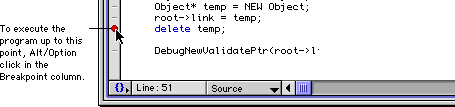
You can assign a custom key binding to this command. See "Customizing the IDE" for more information.
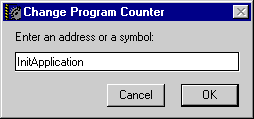
If you want to move the current-statement arrow by specifying a new address or by specifying a symbol, use the Change Program Counter dialog box shown in Figure 11.46. To open this dialog box, choose Debug > Change Program Counter. Type in the field the address or symbol name to which you want to skip, then click OK. If possible, the debugger moves the current-statement arrow to the specified address or symbol. If the debugger cannot move the arrow to the destination you specified, or if the symbolics file does not contain the address or symbol that you entered, an error message appears.
While your program is running, you can use the Stop command (Figure 11.47) to suspend execution and explore your code with the debugger. You can then step through your code from that point, or use the Run command to resume execution.
Stopping in this manner is not very precise. Code executes very quickly, and there is no telling exactly where the debugger suspends your program when you issue the Stop command. Instead of stopping code, you can use breakpoints, which allow you to suspend program execution at a specific point. To learn more, see "Breakpoints".
Stop Command: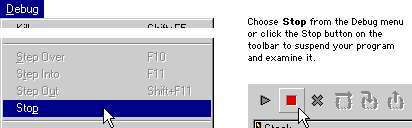
 NOTE
NOTE
Stop command is not available for some build targets because it is dependent on operating system services. For details on any particular build target, see the corresponding Targeting manual as described in "Targeting Documentation".
TIP
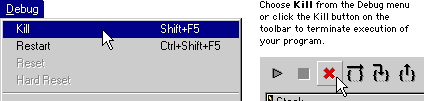
Sometimes you want to terminate your program completely and end the debugging session. The Kill command (Figure 11.48) ends the program and returns control to the debugger. The Thread window tells you when the program is running, and to choose Debug > Stop to stop its execution.
Kill Command: