[ First ] [ Previous ] [ Next ] [ Last ] [ Manuals ]
Thread Window

At the beginning of a debugging session, the IDE opens a Thread window, shown in Figure 11.3. CodeWarrior documentation uses several names for the Thread window, depending on the part of the window being emphasized. The following names might appear:
The term Thread window appears throughout the remainder of the CodeWarrior IDE User Guide. However, you should remember the alternative names when reading other CodeWarrior documentation.
Thread Window: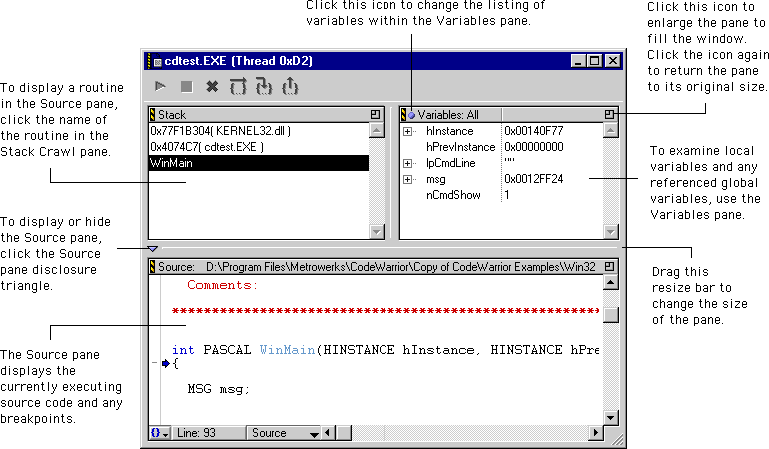
The debugger allows you to open several symbolics files at the same time. This feature allows you to debug more than one program at a time. For example, you can simultaneously debug an application and its plug-ins. A Thread window appears for each active thread.
The Thread window shows debugging information about the currently suspended process. The window has four points of interest:
Debugger toolbar
Stack Crawl pane
Variables pane
Source pane
You can resize panes by clicking and dragging the resize bar between them. Use the Tab key to switch keyboard focus among panes. On the Mac OS-hosted IDE, the pane in focus has a heavy border.
To select items in a focused Stack Crawl pane or Variables pane, type the first few characters of the item's name. Alternatively, use the arrow keys to navigate among the items in an active pane.
Mac OS
You can also press Control-Tab as another way to navigate through items in an active Stack Crawl pane or Variables pane. To learn more about such key bindings, see "Customizing Key Bindings".
There are additional controls along the bottom of the Source pane, to the left of the horizontal scroll bar:
Debugger toolbar
The debugger toolbar (Figure 11.4) contains shortcut buttons for commonly used commands from the Project and Debug menus:
For more information about debugging, see "Basic Debugging."
Showing and Hiding the Debugger Toolbar:
Debugger Toolbar: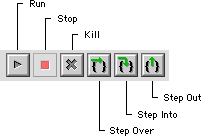
Stack Crawl pane
The Thread window includes a Stack Crawl pane. This pane displays the current subroutine calling chain (Figure 11.5). Each subroutine appears below the routine that called it. Select any routine in the Stack Crawl pane to display its code in the Source pane.
Stack Crawl Pane: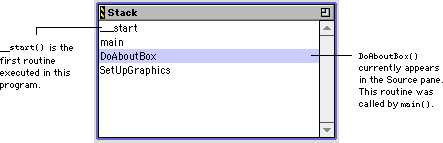
Variables pane
The Variables pane displays a list of local variables used in the program. The Variables Pane Listing icon ( ), shown in Figure 11.6, controls the listing of these variables. Clicking the icon toggles the list in the Variables pane among the types described in Table 11.3.
Variables Pane List Types:
Mac OS
The Variables pane also displays any global variables referred to by the routine. A dashed line separates local and global variables.
The Variables pane lists the variables in outline form. Click the hierarchical control next to an entry to expand or collapse the view of its contents.
For example, in Figure 11.6, clicking the hierarchical control next to the variable msg hides its members. Click the hierarchical control again to display the members. To de-reference multiple levels of pointers and get directly to the data, use one of the following techniques:
Windows, Solaris, and Linux
Press the Ctrl key while expanding an entry.
Mac OS
Press the Option key while expanding an entry.
This feature is useful for expanding a handle to a structured type and viewing the structure members.
Variables Pane: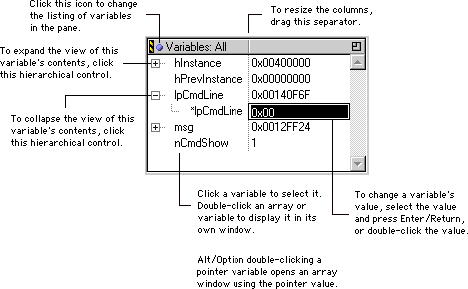
For more information about expanding and collapsing entries, see "Expanding and Collapsing Groups".
 NOTE
NOTE
Use the General Registers and FPU Registers windows to view the contents of the central-processor and floating-point registers. If the current build target does not have an FPU, the FPU Registers window is not available. For more information, see "Register Windows".
The Source pane (Figure 11.7) in the Thread window displays source code. The debugger takes the source code directly from the source code files in the current build target, including any comments and white space. The pane shows C/C++, Pascal, Java, and in-line assembly code exactly as it appears in your program's source code, using the font and color specified in the Editor Settings preference panel.
Click the Source pane disclosure triangle, shown in Figure 11.3, to show or hide the Source pane. If you hide the Source pane, the debugger opens both an editor window and a Thread window after you step once through your code. The editor window shows the same source code and breakpoints as the Source pane.
Source Pane in the Thread Window: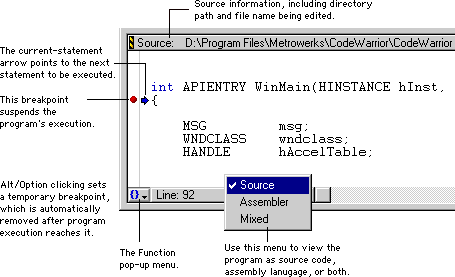
The Source pane lets you step through the source code line by line. The current-statement arrow, which always points to the next statement to be executed, indicates your progress. The program counter in the central processing unit of your computer is set to the instruction address pointed to by the current-statement arrow. Thus, the current-statement arrow is also known as the program counter.
The debugger executes all statements in a source-code line with each step through your code. The current-statement arrow dims whenever the program counter is within, but not at the beginning of, a source-code line. If the source-code line contains more than one routine, you must step over, step into, or step out of each routine of interest.
Source pop-up menu
The Source pop-up menu, shown in Figure 11.7, allows you to view the code in the Source pane in a variety of formats. You can choose among the following views:
-
Source-In this view, shown in Figure 11.8, the source code appears in the programming language instructions used to create it.
-
Assembler-In this view, shown in Figure 11.9, the source code appears in the assembly language instructions used to implement each line. You can step through the assembly code and set breakpoints, one routine at a time.
-
Mixed-In this view, shown in Figure 11.10, the assembly language instructions that implement each source-code line appear immediately after that line. Syntax coloring is not available in this view. You can step through code and set breakpoints, but only for assembly language instructions, as shown in Figure 11.10. The view reverts to Assembler for source code that does not contain symbolics information.
NOTE
Use the General Registers and FPU Registers windows to view the contents of the central-processor and floating-point registers. If the current build target does not have an FPU, the FPU Registers window is not available. For more information, see "Register Windows".
Source View: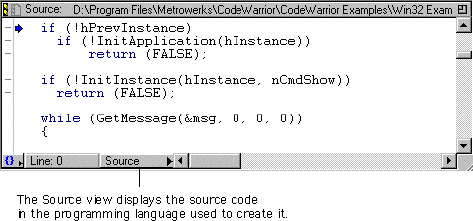
Assembler View: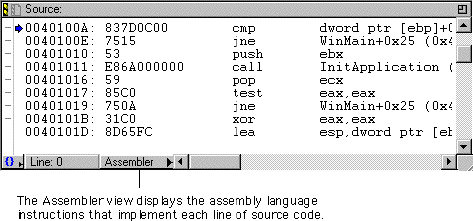
Mixed View: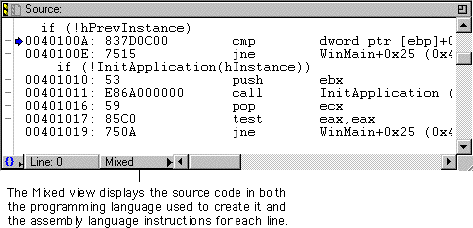
Function pop-up menu
The Function pop-up menu, at the bottom-left corner of the Source pane, contains a list of the routines defined in the source file selected in the Source pane (Figure 11.11). Selecting a routine in the Function pop-up menu displays that routine in the Source pane.
You can also display the items in alphabetical order. Use one of the following techniques:
Windows, Solaris, and Linux
Alt-click the Function pop-up menu
Mac OS
Option-click the Function pop-up menu
Function Pop-up Menu: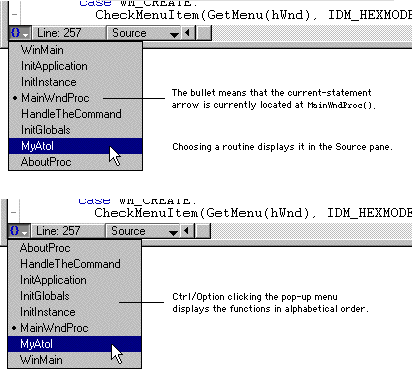
[ First ] [ Previous ] [ Next ] [ Last ] [ Manuals ]
Visit the Metrowerks website at: http://www.metrowerks.com
For assistance contact Metrowerks Technical Support at: cw_support@metrowerks.com
Copyright © 2000, Metrowerks Corp. All rights reserved.
Last updated: August 17, 2000