[ First ] [ Previous ] [ Next ] [ Last ] [ Manuals ]
Browser Window

The Browser window (Figure 7.2) gives you a class-based view of the information in the browser database. The window has several panes displaying lists of information.
You can open Browser window using several techniques:
 TIP
TIP
The Browser window has a toolbar. To learn how to use and customize the toolbar, see "Customizing the IDE." When browsing rapid application development (RAD) projects, the Browser window has a tab control. To learn how to use the tab control, refer to "RAD Browsing".
The Classes pane, Member Functions pane, and Data Members pane are lists of their respective data. Clicking within a particular pane makes it the active pane. You can also use the Tab key to rotate through all the panes (except for the Source pane).
TIP
Using the Tab key can be mildly hazardous to your source code. If the Source pane is active and you press the Tab key, you enter a tab into your source code. Once you are in the Source pane, you cannot press the Tab key to get out of it.
Windows
Use the mouse to select a different pane.
Mac OS, Solaris, and Linux
Use the mouse or press Option-Tab to move to a different pane. A focus outline surrounds the active pane.
You can click an item in any list to select it, or navigate through the items in the active list by typing or using the arrow keys. You can also select items by typing their names. The selection changes to most closely match the characters you type.
Mac OS, Solaris, and Linux
Use the Control-Tab key combination to cycle through list items alphabetically.
The items in this window include:
Browser toolbar
The toolbar provides easy single-click access to many CodeWarrior commands. The buttons that are displayed in the Browser window's toolbar are listed in Table 7.2.
Browser toolbar buttons:
Browser Access Filters pop-up menu
The Browser Access Filters pop-up menu controls the display of member functions and data members in the Browser view. The pop-up menu's commands "filter" the display according to public, private, and protected access types. A mark is displayed next to each enabled filter. The available choices in the pop-up menu are described in Table 7.3.
The first three choices represent shortcuts to multiple filters. For example, instead of using the Browser Access Filters pop-up menu three times in succession to enable public, private, and protected filters, choose View as implementor to enable all three filters simultaneously.
After you enable a particular filter, the access icons change in the bottom-right corner of the Browser window. Darkened icons, as shown in Table 7.3, indicate enabled filters. Grayed-out icons represent disabled filters.
Browser Access Filters pop-up menu commands:
Pane zoom box
The pane zoom box enlarges and shrinks panes in the browser.
 Click this box to enlarge a pane to fill the Browser window.
 Click this box to shrink a pane to its original size.
Resize bar
A resize bar is located between each pair of panes, as illustrated in Figure 7.2. To resize two panes, drag the resize bar located between them.
TIP
When a source file is displayed in the Source pane, pressing Control/Command-\Q opens the associated interface file. If the file in the Source pane is an interface file, you open the related source code file, and vice versa.
Classes pane
The Classes pane lists all the classes in the browser database.
You can view the list alphabetically or by class hierarchy. Toggle the view by clicking the List button at the top right of the pane, as shown in Figure 7.2.
In the Hierarchy view, hierarchy expansion triangles are displayed next to class names that have subclasses, as shown in Figure 7.3. Click the expansion triangle to show or hide subclasses.
TIP
In the Classes pane, Alt/Option click a hierarchical control to open all subclasses at all levels. This is a "deep" disclosure. Ctrl/Command click to open a single level of subclass in a class and all of its siblings at the same level. This is a "wide" disclosure. Ctrl/Command-Alt/Option-click to open both wide and deep.
When you select a class in the Classes pane, the Multi-Class Hierarchy Window selection changes too. The Hierarchy view scrolls to the newly selected class if necessary.
 NOTE
NOTE
The Classes pane does not display information about classes or structures that do not have any member functions, base classes, or subclasses. Thus, structures and classes that just have fields and data members are not displayed.
List button
The List button at the top right of the Classes pane controls the listing of classes. You can toggle between an alphabetical list or a hierarchical list.
 Click this button to switch to an alphabetical list.
 Click this button to switch to a hierarchical list.
The Browser window with the Classes pane hidden :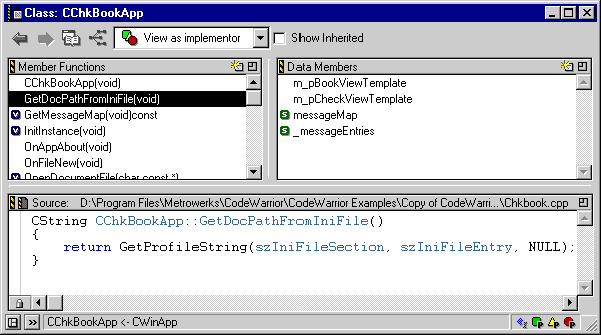
Classes Pane button
The Classes Pane button at the bottom left of the Browser window controls the display of the Classes pane.
 Click this button to hide the Classes pane (Figure 7.6).
 Click this button to display the Classes pane (Figure 7.2).
Class Declaration button
The Class Declaration button at the bottom left of the Browser window lets you access the declaration of the current class.
 Click this button to show the declaration of the current class in the Source pane. The Status area of the Browser window shows the name of the current class.
Member Functions pane
The Member Functions pane lists all member functions defined in the selected class. Constructors and destructors are at the top of the list. After that, all other entries are listed in alphabetical order.
You can also display inherited member functions by enabling the Show Inherited checkbox in the toolbar. The Inherited access icon in the Browser window ( ) darkens to indicate that inherited member functions are currently displayed.
TIP
If you select a member function in the Member Functions pane in the Browser Window, you can use the Enter/Return key to open an editor window and view the definition of the selected function.
Data Members pane
The Data Members pane lists all data members defined in the selected class. You can also display inherited data members by enabling the Show Inherited checkbox in the toolbar. The Inherited access icon in the Browser window ( ) darkens to indicate that inherited data members are currently displayed.
The entries in the Data Members pane are listed in alphabetical order. If inherited members are displayed, data members are listed by superclass, but alphabetically within each class.
TIP
If you select a data member in the Data Members pane in the Browser Window, you can use the Enter/Return key to open an editor window and view the declaration of the selected data member.
Identifier icon
A routine or data member can have an identifier icon beside its name. The following table describes the icons.
Browser identifier icons:
Source pane
The Source pane displays the source code for the selected item. If the item is a class, the pane shows the class declaration. If the item is a routine, the pane shows the routine definition. If the selected item is a data member, the pane shows the data member declaration from the interface file.
NOTE
If you Alt/Option click an item in the Member Functions pane or the Data Members pane, that item is entered into the Source pane text at the current insertion point. This is an efficient way to enter routine calls or variable names into the Source pane.
The text in the Source pane is fully editable. The path to the file that contains the code on display is shown at the top of the Source pane.
Open File icon
 The Open File icon is located at the top of the Source pane. Click this icon to open the file that contains the code displayed in the Source pane. The source code is displayed in a new editor window.
VCS pop-up menu
 This pop-up menu lets you use revision control with the source file you are viewing. To learn more about how to use this feature, refer to the discussion in "Common VCS Operations".
Status area
The status area displays various status messages and other information. For example, when you select a class from the Classes pane, the status area displays the base class(es) for the selected class.
[ First ] [ Previous ] [ Next ] [ Last ] [ Manuals ]
Visit the Metrowerks website at: http://www.metrowerks.com
For assistance contact Metrowerks Technical Support at: cw_support@metrowerks.com
Copyright © 2000, Metrowerks Corp. All rights reserved.
Last updated: August 17, 2000


