[ First ]  [ Previous ]  [ Next ]  [ Last ]  [ Manuals ]


Navigating Code

This section discusses the various ways you can move around in your code. This skill is vital when you want to set breakpoints at particular locations. The debugger lets you navigate code in the following ways:


Linear navigation

You can "walk" through your code by using the Step Over, Step Into, and Step Out commands as needed until you reach the place you want. This technique is useful for short stretches of code, but not very helpful when you want to get to a specific location several steps away.

"Stepping through a single line," "Stepping into routines," and "Stepping out of routines" describe various ways to linearly navigate your code.


Call-chain navigation

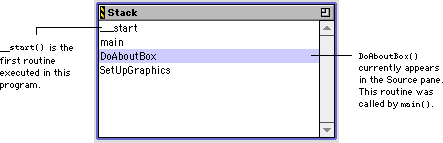
The Stack Crawl pane of the Thread window (Figure 11.49) shows routine call chain. Each routine in the chain appears below its caller, so the currently executing routine is at the bottom of the chain and the first routine to execute in the program is at the top.

Stack Crawl Pane:
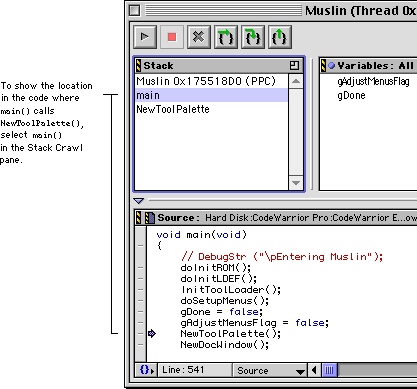
You can use the Stack Crawl pane to navigate to the routines that called the halted routine. To find the point where a routine in the Stack Crawl pane is called, click the name of the routine caller. The source code for the caller appears in the Source pane at the point of the call (Figure 11.50).

Finding the Point Where a Routine is Called:
Symbolics window navigation

You can use the Symbolics window to jump to any location in your source code. The debugger displays this window only when you open a symbolics file. To view a specific routine, follow these steps:

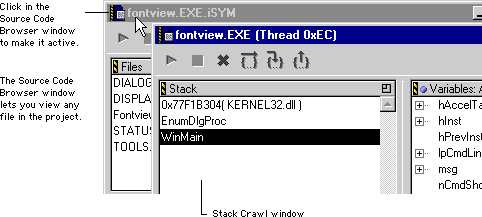
1. Ensure that the Symbolics window (Figure 11.51) is active.

Activating the Symbolics Window:
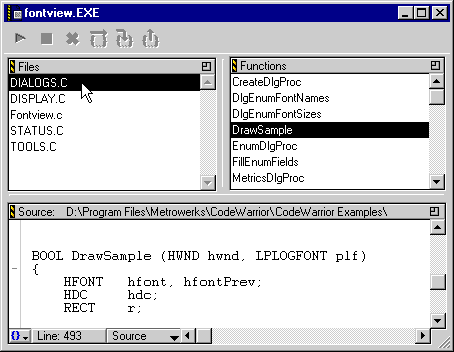
2. In the Files pane of the Symbolics window, select the file that contains the routine's definition (Figure 11.52).

Click the desired file, or use the arrow keys to scroll through the list. The source code for that file appears in the Source pane. You can also type the name of the file.

Selecting a File to View Its Contents:
3. Locate the desired code in the source file.

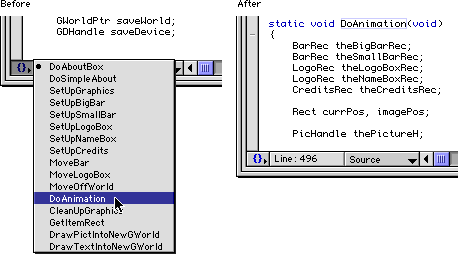
Scroll through the Source pane to find the code you want. A more useful technique is to use the Functions pane or Function pop-up menu to select the desired routine (Figure 11.53). The routine appears in the Source pane, allowing you to set and clear breakpoints. For more information, see "Breakpoints."

Choosing a Routine to View:
Changing font and color

The debugger displays source code in the font and color specified in the Editor preference panels of the IDE Preferences window.

For more information, see "Editor Preferences".


[ First ]  [ Previous ]  [ Next ]  [ Last ]  [ Manuals ]

Visit the Metrowerks website at: http://www.metrowerks.com
For assistance contact Metrowerks Technical Support at: cw_support@metrowerks.com
Copyright © 2000, Metrowerks Corp. All rights reserved.

Last updated: August 17, 2000